Learn how to deliver powerful analytics over data in motion with Feldera and Redpanda
In this post, we introduce the Feldera Continuous Analytics Platform to the Redpanda Community and demonstrate how Feldera and Redpanda can work together to deliver powerful analytics over data in motion.
Let’s get started.
What is Feldera?
Feldera is an early-stage startup building a next-generation platform for continuous analytics. The Feldera platform maintains a set of standing queries, or views, over a changing dataset, making query results for the most recent input data available in real time, typically with the latency ranging from milliseconds to several seconds. It achieves this using incremental query evaluation.
Instead of reevaluating the queries from scratch every time, Feldera reuses the work it has previously done, only performing a small amount of additional computation necessary to adjust the outputs for the new inputs.
Feldera supports queries written in standard SQL. If you know SQL, you’re ready to do continuous transformation and analytics with Feldera.
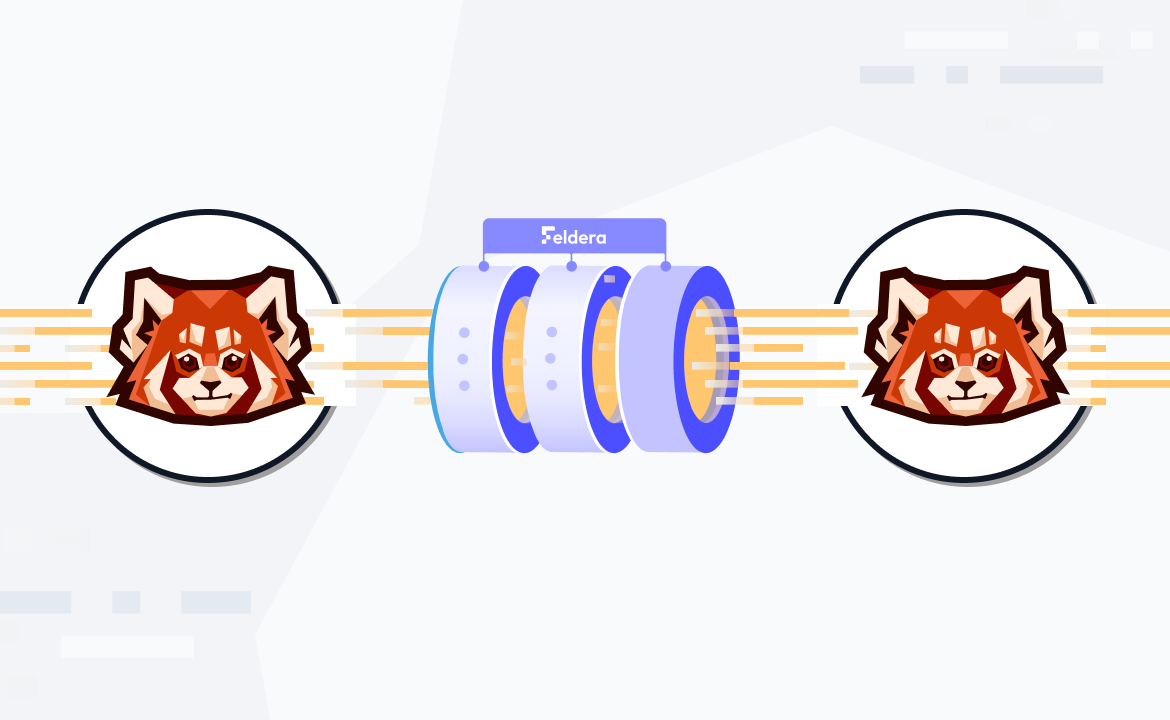
Multiple sources, multiple destinations, one message queue
Feldera operates over data en route from a source to a destination. Possible sources include databases, IoT devices, log streams, etc. Destinations can be databases, data lakes, real-time dashboards, ML inference models, etc. A Feldera pipeline can connect multiple heterogeneous sources to multiple destinations.
Whatever the sources and the destinations are—we need a reliable, high-performance message queue to efficiently deliver input data to Feldera and to deliver the outputs of Feldera to the destinations. This is where Redpanda steps in.

ETL on steroids or batch analytics at the speed of light?
The above diagram looks a lot like the Extract, Transform, Load (ETL) flow. You can think of Feldera and Redpanda as a real-time ETL system on steroids, where the "T" phase can run arbitrary SQL queries on moving data.
However, the combination of Feldera and Redpanda opens up an even more intriguing possibility. In today's ETL workflow, once data has been loaded into the target database or data warehouse, the usual next step is to run complex analytical queries to extract business value from the data. These queries run as periodic batch jobs, which take hours to complete and require massive computing resources (and incur massive costs).
So what if we could eliminate the batch jobs and evaluate the same SQL queries on the fly using Feldera? From the end user's perspective, this would look as if the results of the batch jobs for the latest data were instantly available on-demand, at a fraction of the cost.
This might sound fanciful to anyone who’s used to waiting hours on end for results to show up—then receive 6-digit cloud bills at the end of the month. But Feldera's unique incremental query evaluation technology will help make this possible.
Demo: building a real-time analytics pipeline with Feldera and Redpanda
To show you how it all connects, we’ll use Feldera and Redpanda to implement a real-time analytics pipeline for a (toy) supply chain management system. The pipeline ingests data about suppliers, customers, and orders, and computes an up-to-date summary of this data. This can be used, for instance, to power a real-time dashboard. The source code for this demo is available in this GitHub repo, or you can see the more detailed tutorial on the Feldera website.
If you’re more of a visual learner, the video below walks through all the steps. If you’d rather go at your own pace, keep scrolling and follow the written demo.
Prerequisites: install and run Feldera and Redpanda
Feldera is available as a containerized service that can be installed using docker compose. The docker compose file can also optionally bring up a Redpanda container. Use the following bash command to start both Feldera and Redpanda:
curl https://raw.githubusercontent.com/feldera/feldera/main/deploy/docker-compose.yml | docker compose -f - --profile demo upAlternatively, if you want to use your existing Redpanda brokers, use the following command, which will run Feldera without Redpanda:
curl https://raw.githubusercontent.com/feldera/feldera/main/deploy/docker-compose.yml | docker compose -f - upCheck our get started guide if you need some extra help. Once the Feldera banner shows up in the terminal, you should be able to open the Feldera Web Console on localhost:8080.
Tip: For the impatient—if you started Feldera using the demo profile as described above, it has created a couple of SQL programs and pipelines. One of these programs, called "Feldera Basics Tutorial" and the associated pipeline "Feldera Basics Tutorial Pipeline" are almost identical to the ones we will manually create in this demo.
Feel free to skim the instructions below and jump straight to Step 5 to start streaming data to Feldera via Redpanda.
Step 1. Create a SQL program
In the Feldera Web Console, navigate to the SQL Programs section and click on Add SQL program. Give the program a name (e.g., "Supply Chain Analytics") and paste the following code into the SQL editor:
create table vendor (
	id bigint not null primary key,
	name varchar,
	address varchar
);

create table part (
	id bigint not null primary key,
	name varchar
);

create table price (
	part bigint not null,
	vendor bigint not null,
	price decimal
);

-- Lowest available price for each part across all vendors.
create view low_price (
	part,
	price
) as
	select part, MIN(price) as price from price group by part;

-- Lowest available price for each part along with part and vendor details.
create view preferred_vendor (
	part_id,
	part_name,
	vendor_id,
	vendor_name,
	price
) as
	select
    	PART.id as part_id,
    	PART.name as part_name,
    	vendor.id as vendor_id,
    	vendor.name as vendor_name,
    	PRICE.price
	from
    	price,
    	part,
    	vendor,
    	low_price
	where
    	price.price = low_price.price AND
    	price.part = low_price.part AND
    	part.id = price.part AND
    	vendor.id = price.vendor;
The program declares three tables, that’ll store the input data, and a pair of views. Note that views can be defined in terms of tables and other views, making it possible to express deeply nested queries. In this example, the PREFERRED_VENDOR view is expressed in terms of the LOW_PRICE view.
Step 2. Test the program using Feldera Web Console
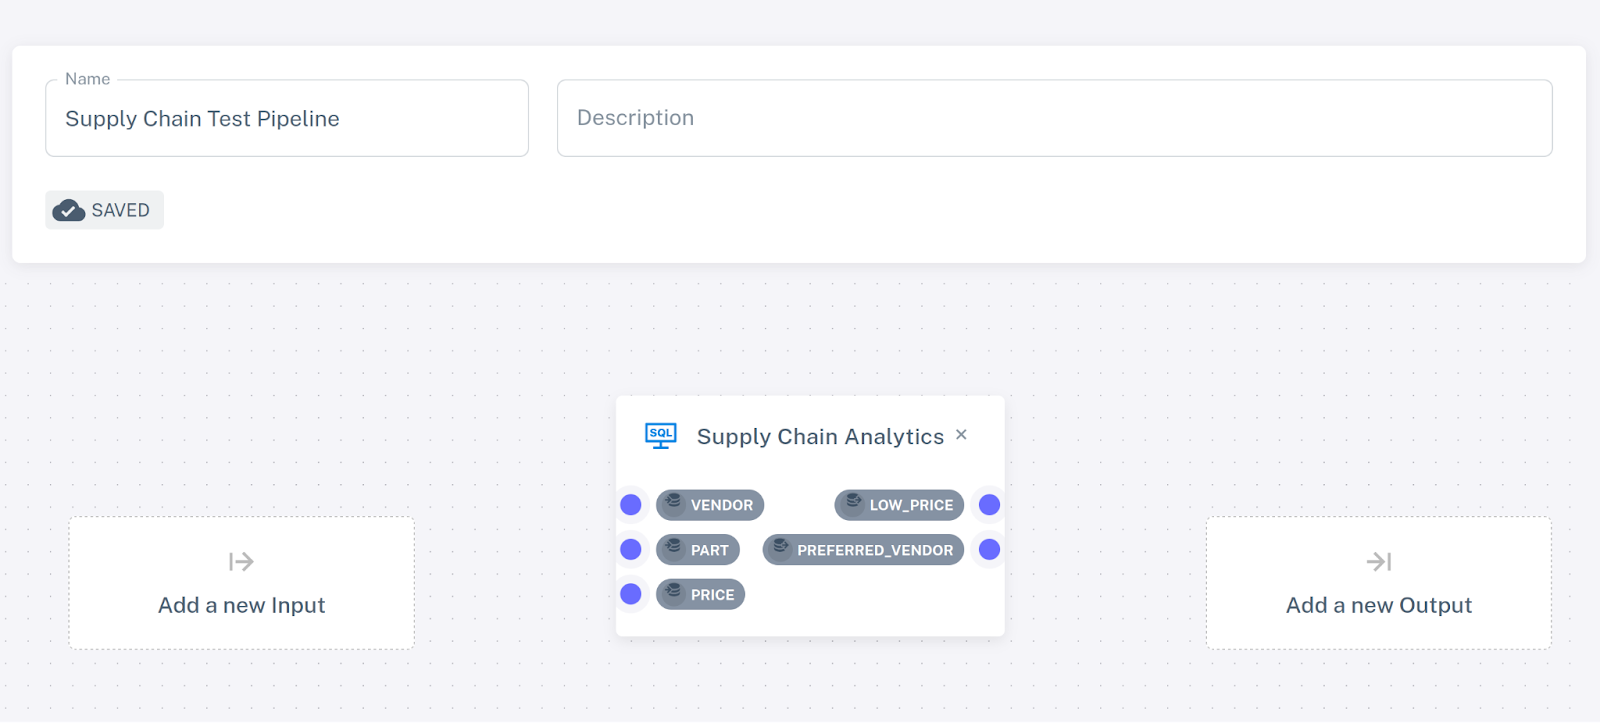
To run our SQL program, we must instantiate it as part of a pipeline. Navigate to the Pipelines section and click Add pipeline. Give the new pipeline a name (e.g., "Supply Chain Test Pipeline") and select Supply Chain Analytics from the list of SQL programs.
The selected program is visualized as a rectangle with a blue dot for each table and view declared in the program. These can be used to connect data sources and sinks. For the time being, we’ll run our pipeline without any sources or sinks.
Tip: To jump directly to sending and receiving data via Redpanda, skip to Step 3.
Go back to the pipelines view (click on Pipelines in the navigation bar on the left). Your newly created pipeline should appear in the list. Next, click the 'Play' icon next to the pipeline.
The pipeline is now running and is ready to process inputs; but since we haven’t connected any data sources to it, no data has been received. Let’s add some manually.
Expand the runtime state of the pipeline and you should see the list of tables and views defined in your program. Click on the "upload" icon next to the PART table.
This will open the view where you can insert new rows to the table using a configurable random data generator (feel free to play around with it!) or by entering the data manually. For example, you might add the following rows:
| ID      	| NAME       	|
| ---------- | -------------- |
| 1       	| Flux Capacitor |
| 2       	| Warp Core  	|
| 3       	| Kyber Crystal  |
Click Insert rows to push the new rows to the table. Switch to the Browse part tab to see the contents of the table, which should contain the newly inserted rows.
Follow the same process to populate VENDOR,
| ID      	| NAME                	  | ADDRESS               |
| ----------- | ---------------------- | --------------------- |
| 1       	| Gravitech Dynamics  	  | 222 Graviton Lane  	   |
| 2       	| HyperDrive Innovations | 456 Warp Way          |
| 3       	| DarkMatter Devices  	  | 333 Singularity Street|
and PRICE,
| PART | VENDOR | PRICE |
| ----------- | -------------------- |----------------------|
| 1 | 2 | 10000 |
| 2 | 1 | 15000 |
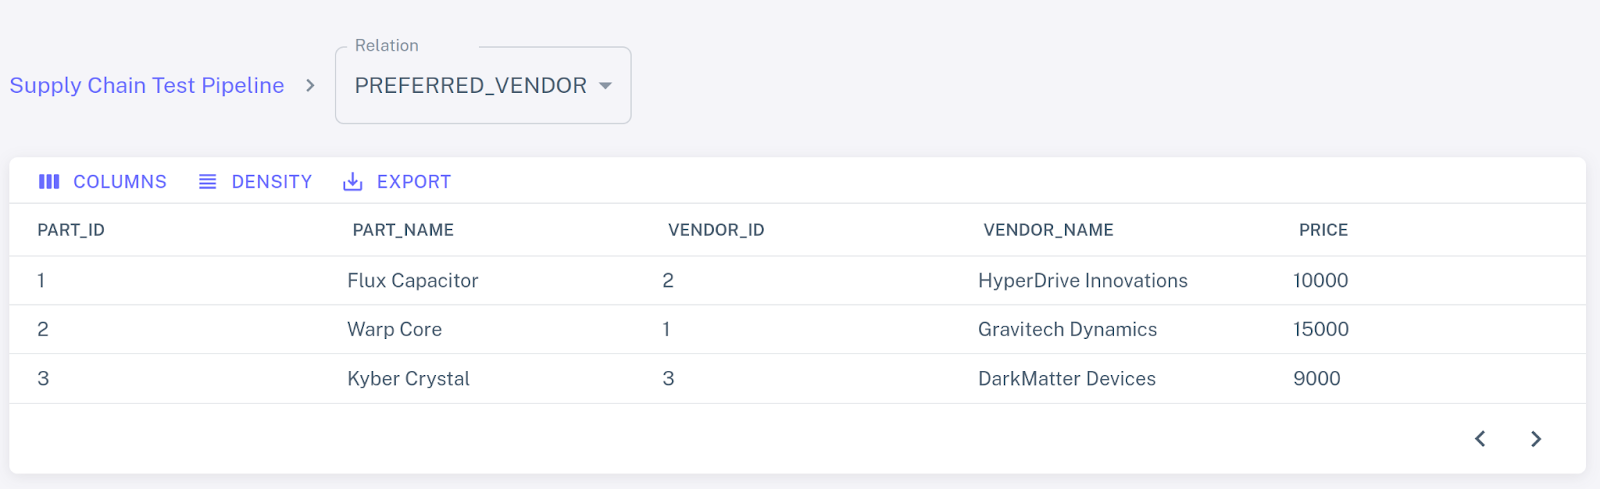
| 3 | 3 | 9000 |Select the PREFERRED_VENDOR view from the dropdown list to see the output of the query:
You can play around with the pipeline, inserting and deleting records and observing how the Feldera continuous analytics engine updates the views in response. When done, click the "stop" icon to shut down the pipeline.
Caution: All pipeline state will be lost.
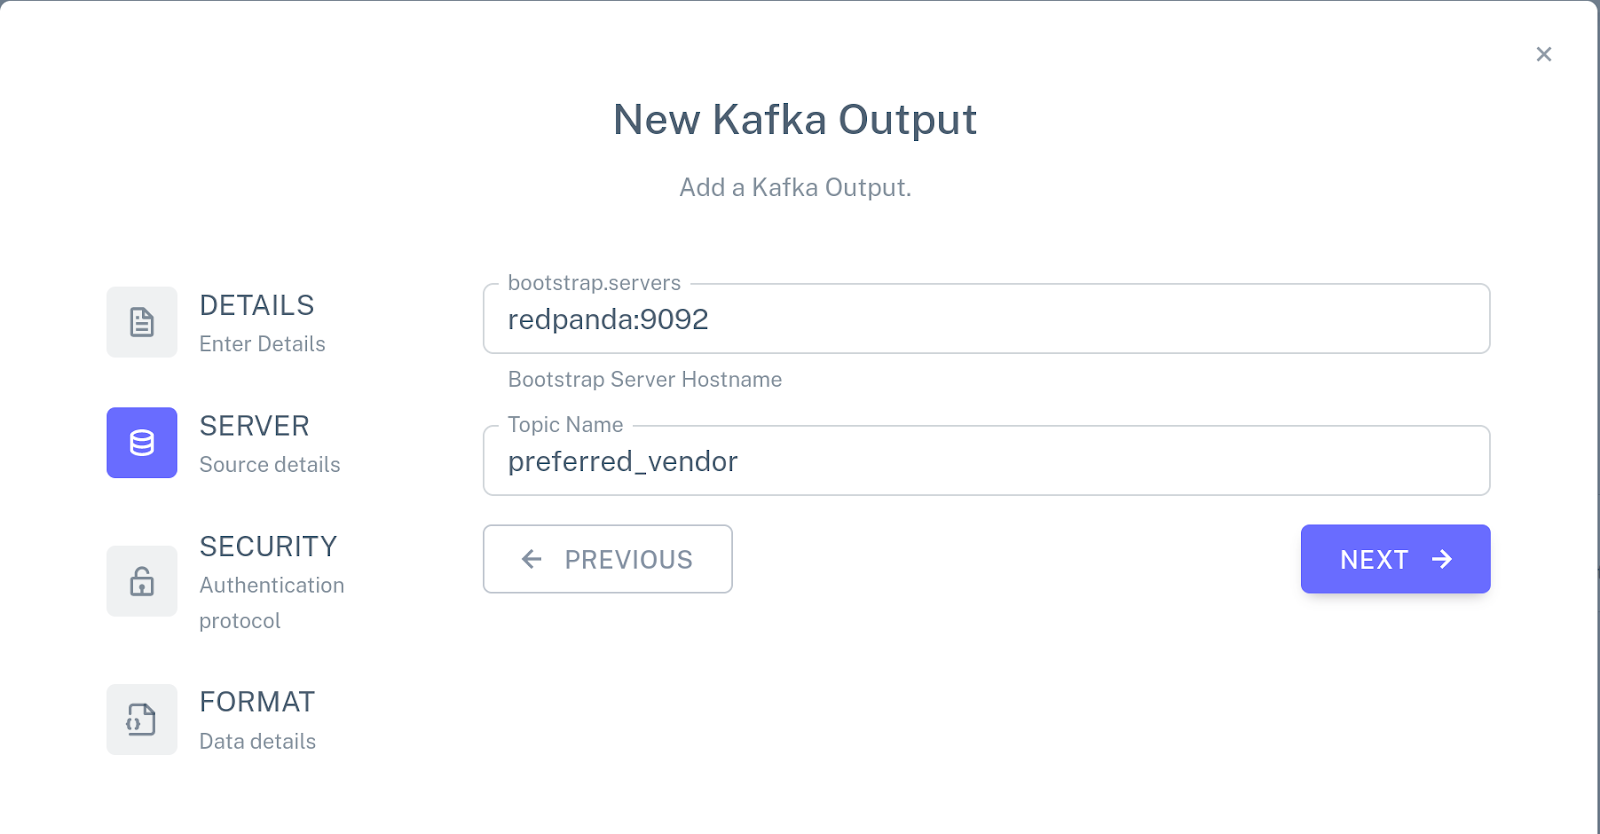
Step 3. Create Redpanda topics
For this, you’ll need the Redpanda CLI client, rpk. Assuming you’re running Redpanda using Feldera's docker-compose file, you should now be able to run the following command to retrieve the state of the Redpanda cluster:
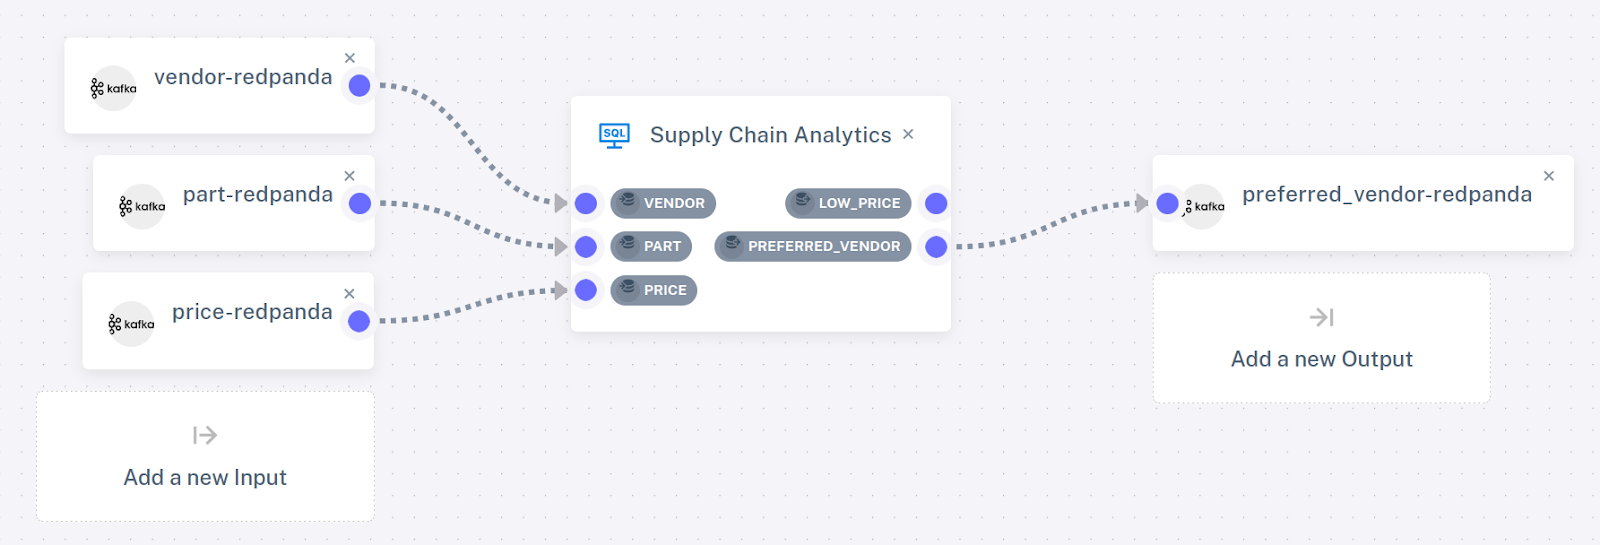
rpk -X brokers=127.0.0.1:19092 cluster metadataCreate the Redpanda topics that’ll send input updates to the VENDOR, PART, and PRICE tables and receive output changes from the PREFERRED_VENDOR view.
rpk -X brokers=127.0.0.1:19092 topic create price vendor part preferred_vendorStep 4. Create input and output connectors
Navigate to the Pipelines section of the Web Console and click the "pencil" icon next to our test pipeline to open the pipeline editor.
Click Add a new input, choose New Kafka connector, and specify the following configuration:

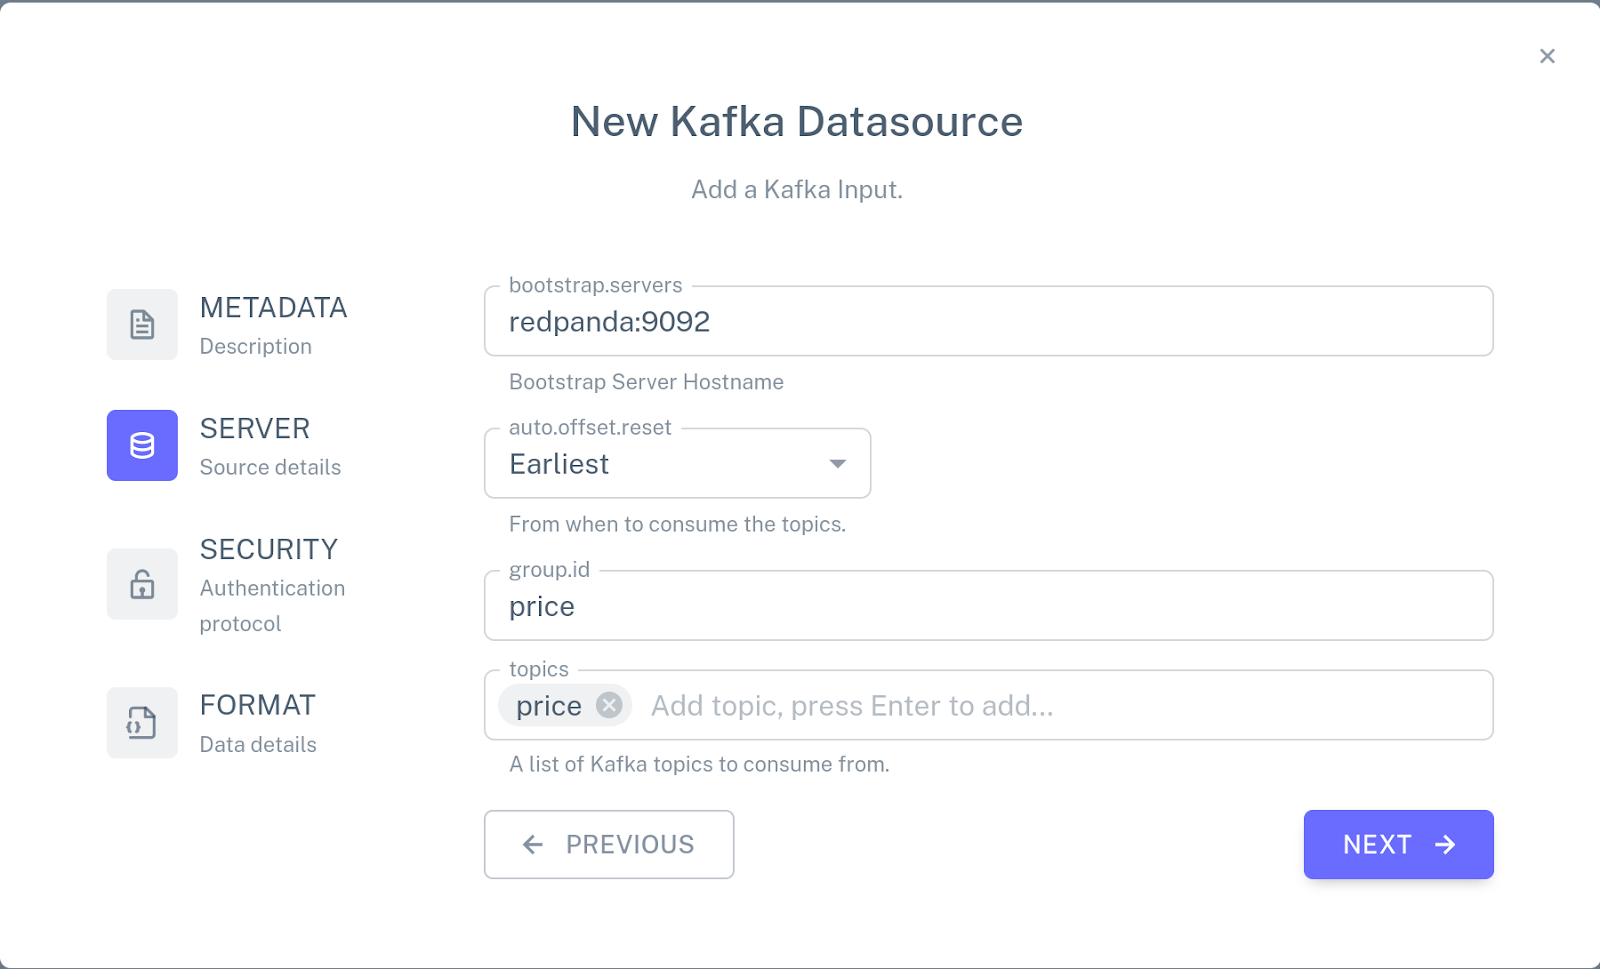
Use the mouse to attach the connector to the PRICE table by connecting the blue dot on the connector with the blue dot next to the name of the table.
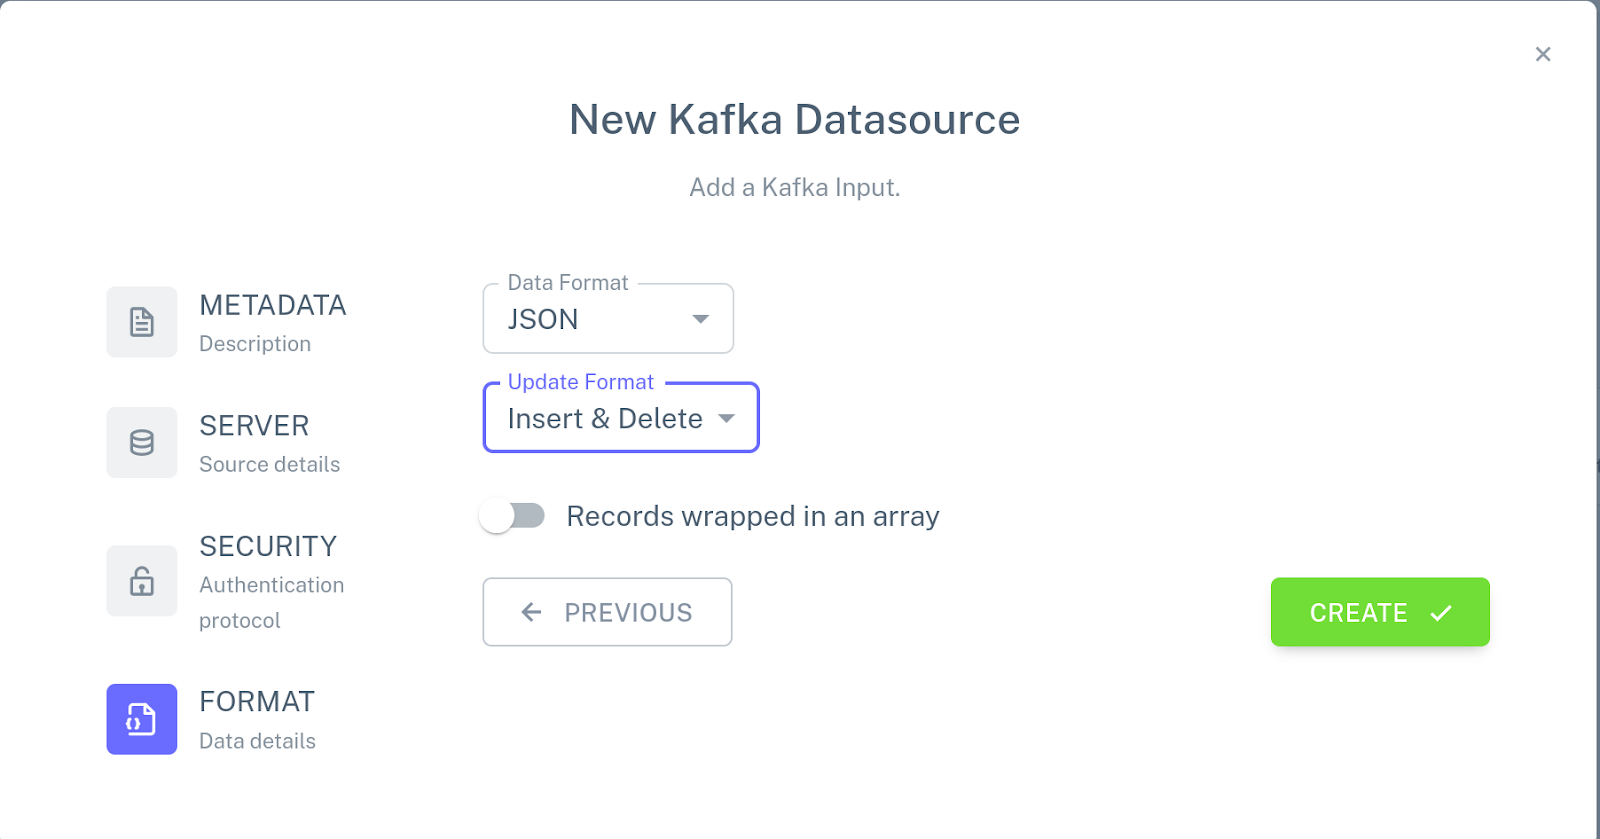
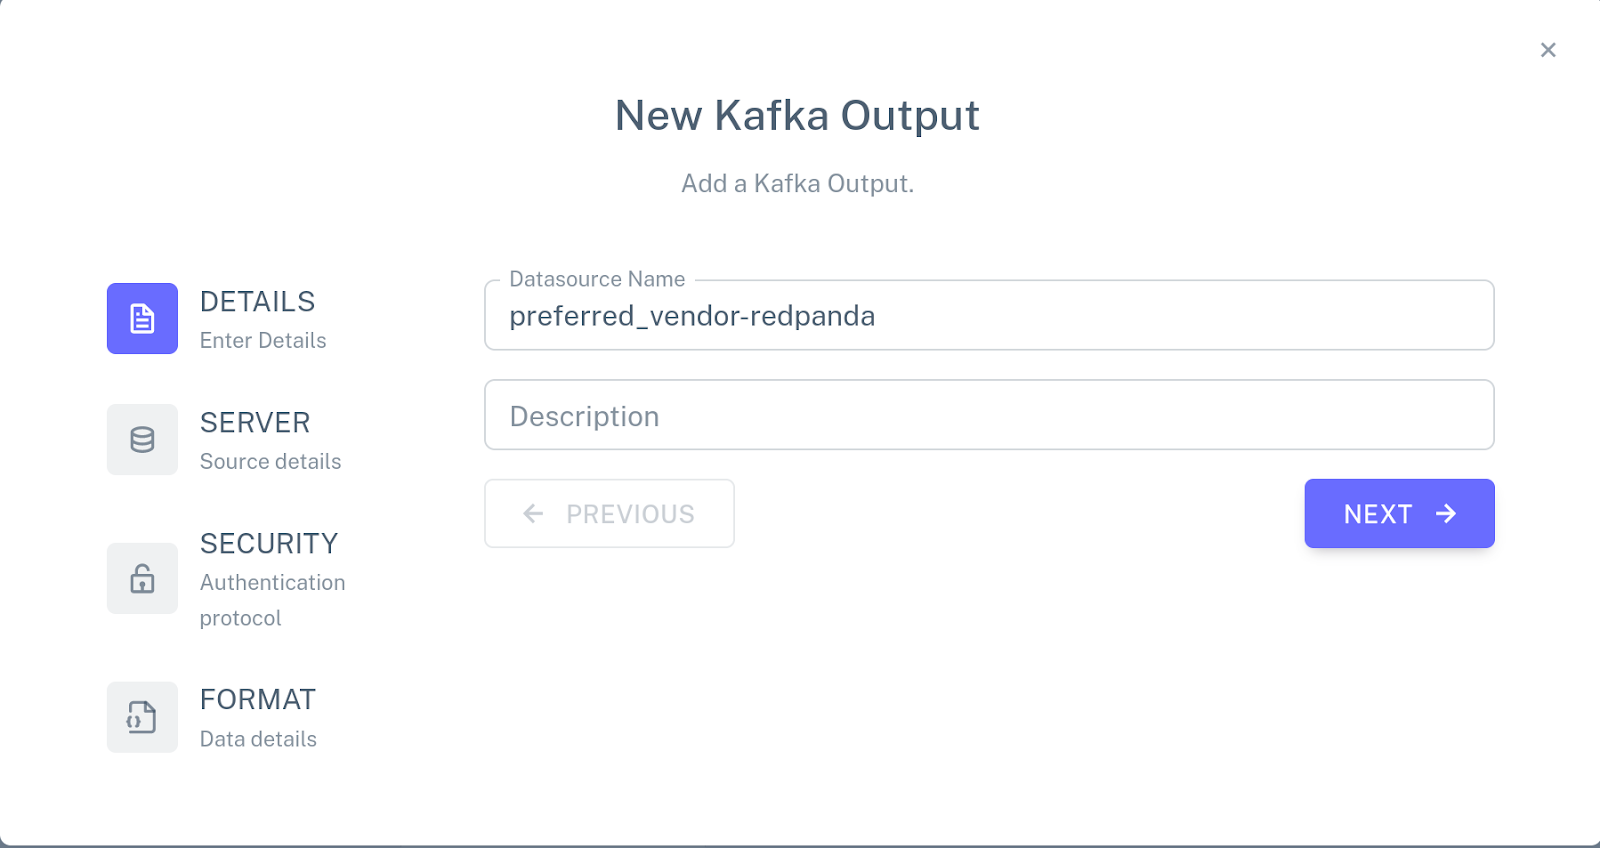
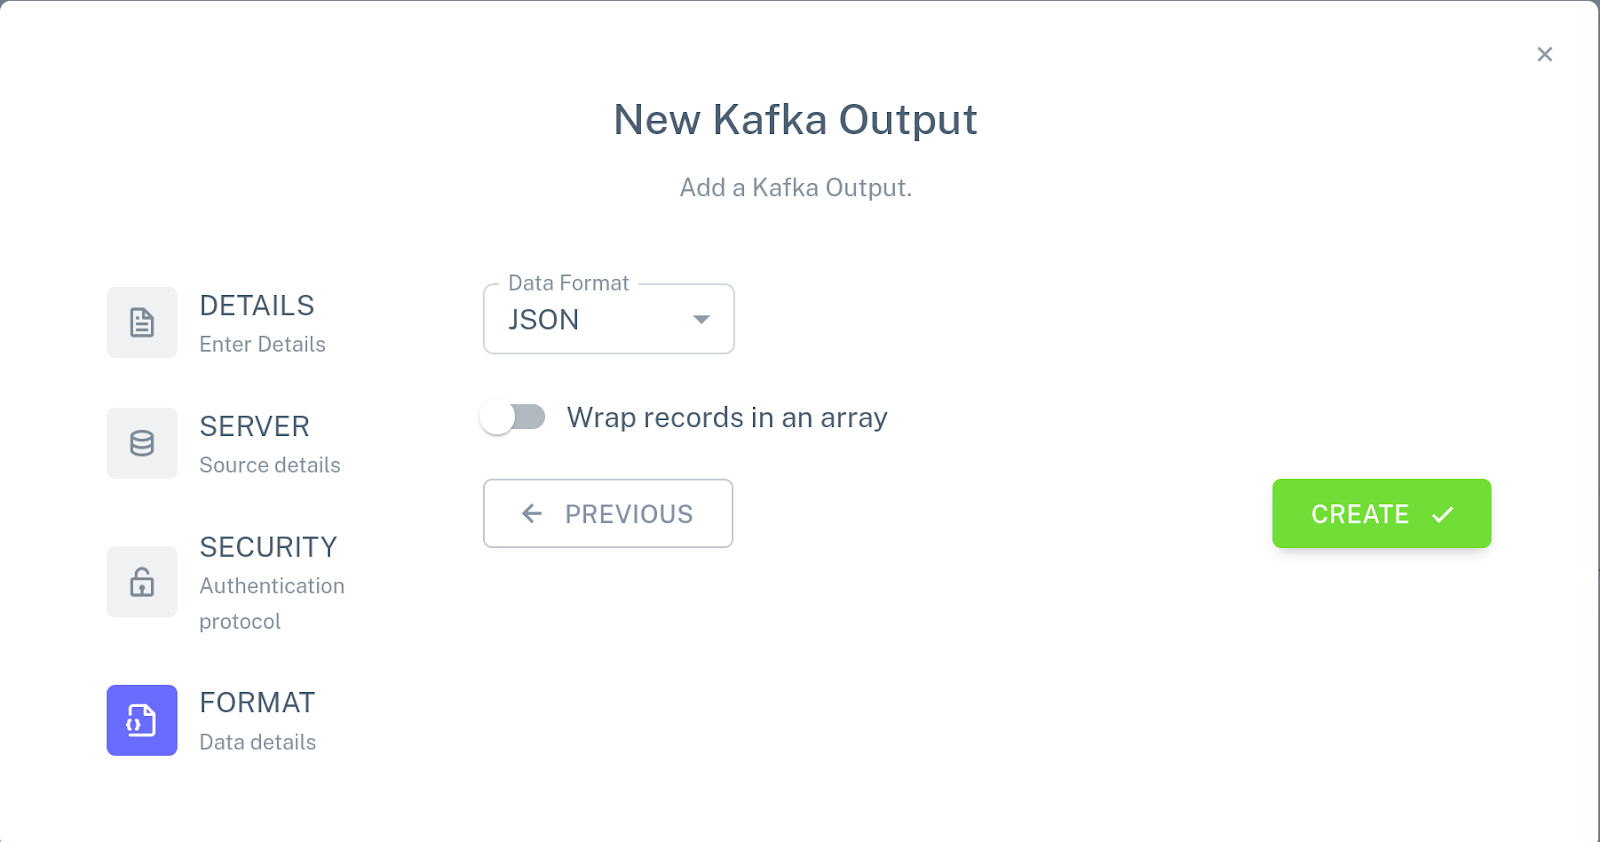
Repeat these steps to create input connectors for the PART and VENDOR tables using part and vendor topics respectively. Then, click Add a new output, choose New Kafka connector, and specify the following configuration for the connector:
Attach this connector to the PREFERRED_VENDOR view. The pipeline configuration should now look like this:
Step 5. Run the pipeline
Go back to the Pipelines view. If the previous configuration of the pipeline is still running, shut it down and start the new configuration of the pipeline by clicking on the "play" icon.
Use the Redpanda CLI to listen to the PREFERRED_VENDOR view:
rpk -X brokers=127.0.0.1:19092 topic consume preferred_vendor -f '%v\n'We haven't sent any input data, so you won't see any outputs yet. Leave the command running and use a different terminal to push some input data to the part, vendor, and price topics:
Note: Using the pre-built demo? Move on to Step 6.
The pre-built pipeline that comes with the Feldera demo container populates the input tables from an S3 bucket. If you’re using this pipeline, then the input tables will populate as soon as you start the pipeline, the
preferred_vendortopic will contain some initial data, and you can skip to Step 6.
# Push data to the `PART` table
echo '
{"insert": {"id": 1, "name": "Flux Capacitor"}}
{"insert": {"id": 2, "name": "Warp Core"}}
{"insert": {"id": 3, "name": "Kyber Crystal"}}' | rpk -X brokers=127.0.0.1:19092 topic produce part -f '%v'

# Push data to the `VENDOR` table
echo '
{"insert": {"id": 1, "name": "Gravitech Dynamics", "address": "222 Graviton Lane"}}
{"insert": {"id": 2, "name": "HyperDrive Innovations", "address": "456 Warp Way"}}
{"insert": {"id": 3, "name": "DarkMatter Devices", "address": "333 Singularity Street"}}' | rpk -X brokers=127.0.0.1:19092 topic produce vendor -f '%v'

# Push data to the `PRICE` table
echo '
{"insert": {"part": 1, "vendor": 2, "price": 10000}}
{"insert": {"part": 2, "vendor": 1, "price": 15000}}
{"insert": {"part": 3, "vendor": 3, "price": 9000}}' | rpk -X brokers=127.0.0.1:19092 topic produce price -f '%v'
The data format we use to feed data to Feldera is documented here, but it’s mostly self-explanatory. It consists of a stream of newline-delimited JSON objects, where each object consists of an insert or delete command and the record to be inserted or deleted is encoded as a JSON object.
If you’re familiar with change data capture (CDC) technologies like Debezium, you can think about this JSON as Feldera's native CDC format. We’re also adding support for the Debezium CDC format, which will be available in an upcoming release.
You should now see the following output in the terminal that listens to the output topic:
{"insert":{"PART_ID":1,"PART_NAME":"Flux Capacitor","VENDOR_ID":2,"VENDOR_NAME":"HyperDrive Innovations","PRICE":"10000"}}
{"insert":{"PART_ID":2,"PART_NAME":"Warp Core","VENDOR_ID":1,"VENDOR_NAME":"Gravitech Dynamics","PRICE":"15000"}}
{"insert":{"PART_ID":3,"PART_NAME":"Kyber Crystal","VENDOR_ID":3,"VENDOR_NAME":"DarkMatter Devices","PRICE":"9000"}}
Step 6. Push changes to the PRICE table
Now, let's push some changes to the PRICE table:
echo '
{"delete": {"part": 1, "vendor": 2, "price": 10000}}
{"insert": {"part": 1, "vendor": 2, "price": 30000}}
{"delete": {"part": 2, "vendor": 1, "price": 15000}}
{"insert": {"part": 2, "vendor": 1, "price": 50000}}
{"insert": {"part": 1, "vendor": 3, "price": 5000}}
{"insert": {"part": 2, "vendor": 3, "price": 11000}}' | rpk -X brokers=127.0.0.1:19092 topic produce price -f '%v'
You should see the following new output updates in the preferred_vendor topic:
{"delete":{"PART_ID":1,"PART_NAME":"Flux Capacitor","VENDOR_ID":2,"VENDOR_NAME":"HyperDrive Innovations","PRICE":"10000"}}
{"insert":{"PART_ID":1,"PART_NAME":"Flux Capacitor","VENDOR_ID":3,"VENDOR_NAME":"DarkMatter Devices","PRICE":"5000"}}
{"delete":{"PART_ID":2,"PART_NAME":"Warp Core","VENDOR_ID":1,"VENDOR_NAME":"Gravitech Dynamics","PRICE":"15000"}}
{"insert":{"PART_ID":2,"PART_NAME":"Warp Core","VENDOR_ID":3,"VENDOR_NAME":"DarkMatter Devices","PRICE":"11000"}}
Note that Feldera does not output the complete view, but only the set of changes to the previous version of the view. As more input changes arrive, Feldera computes additional output updates on top of all previous updates.
This reflects the internal workings of Feldera: instead of re-evaluating the query from scratch on every new input, it only updates affected outputs by propagating input changes through the query execution plan.
“DarkMatter Devices” is now the preferred vendor for both flux capacitors and warp cores. (We bet they’re using Feldera and Redpanda to cut costs and streamline their manufacturing process!)
Conclusion
This demo is just one of many examples where Redpanda connects to next-gen technologies and brings its famously simplified developer experience so you can easily build highly scalable and efficient streaming data pipelines.
While Feldera is still in its early days, we already released a dev preview of the platform and are working toward a production release. We‘re still beavering away at core functionality like storage and scale-out, and beginning to add handy integrations with various data sources and sinks.
It may not be time to scale down your Snowflake clusters running those expensive batch jobs just yet, but we hope that this demo provided a sneak peek into the exciting things that lie ahead. Stay tuned to see what else you can do with Feldera and Redpanda!
Resources
Check out our SecOps demo for a more sophisticated example of Feldera and Redpanda working together to process larger volumes of data.
Check out Feldera’s GitHub repo and Redpanda’s GitHub repo.
Have questions for the team? Join the Feldera on Slack or find hop into the Redpanda Community on Slack.
For a deep dive into Feldera's incremental query evaluation algorithm, see this research paper and the accompanying video.
— Leonid Ryzhyk, CTO and Co-Founder at Feldera
Originally published on Feldera.com
Let's keep in touch
Subscribe and never miss another blog post, announcement, or community event. We hate spam and will never sell your contact information.


