Capture real-time insights using Redpanda’s high speed, low-cost streaming data platform.
Welcome to part three of our series on Redpanda for gaming! The first post covered 5 popular data streaming use cases in the gaming industry. The second post dove into the first use case and walked through how to build a real-time gaming leaderboard using Redpanda—a streaming data platform that gives game developers the simplicity, speed, and scale they need.
In this post, we’ll look at real-time game data analysis, where speed and accuracy are critical. To truly capture the value of real-time data, gaming events like player engagement, game telemetry, monetization, and quality events need to be ingested as they happen. The challenge for most gaming architectures is streaming this data at high speed and low cost, no matter the scale.
To illustrate this use case, we’ll show you how you can streamline real-time game data analysis using Redpanda as your streaming data platform. In this example, we’ll seamlessly ingest gaming events from Redpanda into the real-time OLAP database Apache Pinot®, and then use the Streamlit framework for visualization.
What makes real-time game data analysis challenging?
Apache Kafka® is widely known and used for real-time data use cases. Perhaps you’ve been using Kafka for years. Most developers have – and for good reason. If this is the case, you probably already know the challenges of scaling a real-time gaming solution. Kafka was built to take the maximum storage throughput out of spinning disks. With the solid state of today’s cloud landscape, the bottleneck has shifted from storage to computing power.
As we covered in our previous post about real-time game leaderboards, popular gaming platforms attract millions of players. At peak hours, they can rack up over a million users online at the same time. While Kafka is great for real-time data streaming, it grows in complexity and expense for use cases like real-time game data analysis.
At Redpanda we’ve built the real-time streaming data platform for developers of the present and future. It’s 100% API-compatible with Kafka and doesn’t need a JVM or Apache Zookeeper™ to operate. If you’re in charge of development or operations at a gaming company, you can do the math. Not only is Redpanda easier, faster, and simpler to work with. It's designed from the ground up to be 6x more cost-effective than Kafka, give you 10x lower latencies, and cut your cloud spend.
From events to insights in seconds
Games generate tremendous amounts of data covering game telemetry, player engagement, and server health metrics. With the right analysis, this data can help gaming companies improve individual player experiences and keep engagement high. Although, for the insights to be valuable for both players and game developers, they need to be timely, precise, and actionable.
Typically, these are the metrics you’ll need to track:
Player engagement: How the game retains players in game sessions and days
Game telemetry: Game health info like hardware resources use, latency, and glitches
Progression: How well players perform in the game
Quality: Errors and bugs in the game
Ad metrics: Ad behavior and revenue
The faster you get these insights, the quicker you can act on them and improve the game’s performance. For example, an infrastructure engineer can act fast to correct an anomaly in the game server’s resource consumption.
However, we tend to trade accuracy for speed in traditional analytics. With modern real-time analytics systems, we need both. This is where Redpanda upgrades your overall data quality by providing a zero data loss architecture, transactional guarantees, and higher ingestion throughputs.
A fast response can benefit the game and the business behind it, but all metrics still need to be tracked cost-effectively as they directly impact revenue. A large-scale gaming analytics system will rack up high operational costs in computing, storage, and labor over time. So the analytics system must support features like tiered data storage and a low hardware footprint to stay economical.
How to build a real-time game data analysis solution
Now that you understand the context, let’s move onto implementing a proven architecture for real-time data analytics. The proposed architecture features Redpanda as the streaming data platform, Pinot as the real-time OLAP database, and Streamlit as the data visualization component.
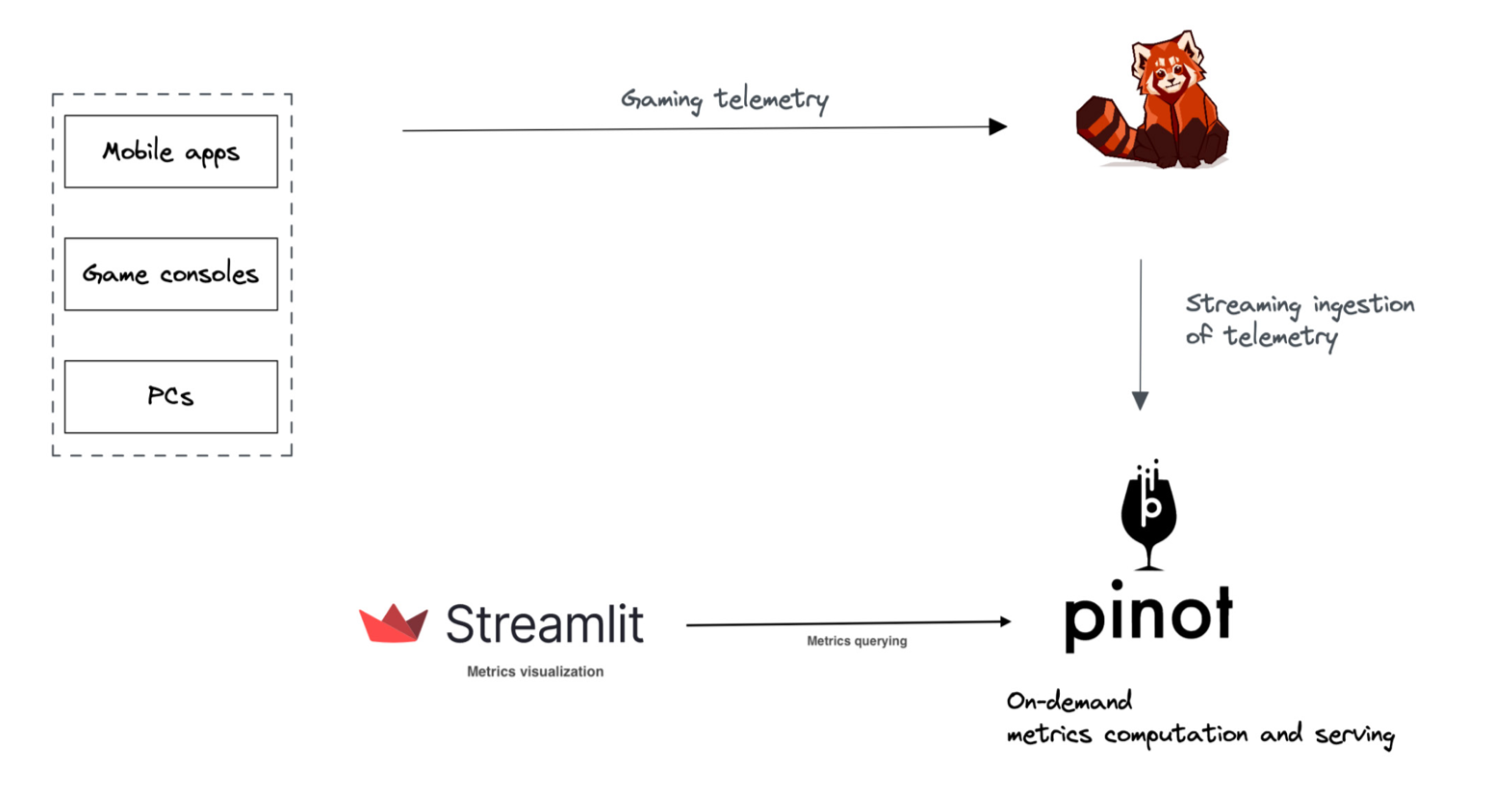
You can build the same real-time game data analytics solution by using the source code shared in this Redpanda Github repo. It’s a Docker Compose project, so you’ll need the following to run the solution on your machine:
Docker and Docker Compose
At least 6 CPU cores and 8 GB of RAM allocated to Docker Daemon
JDK version 8 or higher
JAVA_HOME environment enabled
Python 3
Apache Maven build tool
Quarkus CLI (optional)
Ready? Let’s go.
1. Capture events from gaming frontends
The first step in gaming data analysis is to capture the events from gaming frontends as soon as they’re produced. Game developers can set the game up to capture and emit contextual events from game frontends. These include mobile and web apps, gaming PCs, and consoles like Xbox and PlayStation. We can broadly categorize these events as follows.
Player engagement events – Trigger when players interact with the game (for instance by shooting, killing, reloading, completing a level, and so on)
Game telemetry events – Periodically indicate overall game and hardware health
Monetization events – Trigger when players see and click on ads
Quality events – When the game encounters errors
For this example, we’ll use a Python script to simulate various events produced by the gaming frontend. You can find the script in the 1-analytics/simulator folder. It randomly produces the following (self explaining) event types to Redpanda:
NEW_USER – A new user has registered with the game
GAME_STARTED – A new game session is started
TRANSACTION – A user performs a transaction like buying a weapon
APPLICATION_ERROR – An error has occurred in the game
GAME_COMPLETED – A user has stopped a game session
2. Ingest events into Redpanda
Now, we ingest the captured events into a storage. Redpanda can be configured to store the ingested events safely and reliably across multiple availability zones (AZs). The configuration is minimal, and Redpanda guarantees that not a single piece of data gets lost in operation. This high reliability improves the accuracy of your analytics.
Since Redpanda is fully compatible with Kafka APIs, various gaming frontends can use Kafka clients to send events to Redpanda without changing any code. The Python simulator script mentioned in step 1 produces events for the gaming.events Redpanda topic.
3. Analyze ingested data with Apache Pinot
When the events land in Redpanda, we can configure Pinot to ingest events and make them ready for fast querying. Pinot supports real-time data ingestion from streaming data sources like Kafka, Apache Pulsar, and Redpanda.
Pinot is ideal for quickly analyzing incoming data and producing insights while the data is still fresh. You no longer need the latency-induced batch ETL approach where data is periodically collected in batches. Pinot’s streaming data ingestion maintains data freshness and ensures relevant insights. You can use Pinot to execute complex OLAP SQL queries on large datasets, which usually have aggregations and filters. Pinot ensures a consistent query latency that falls under the millisecond’s range.
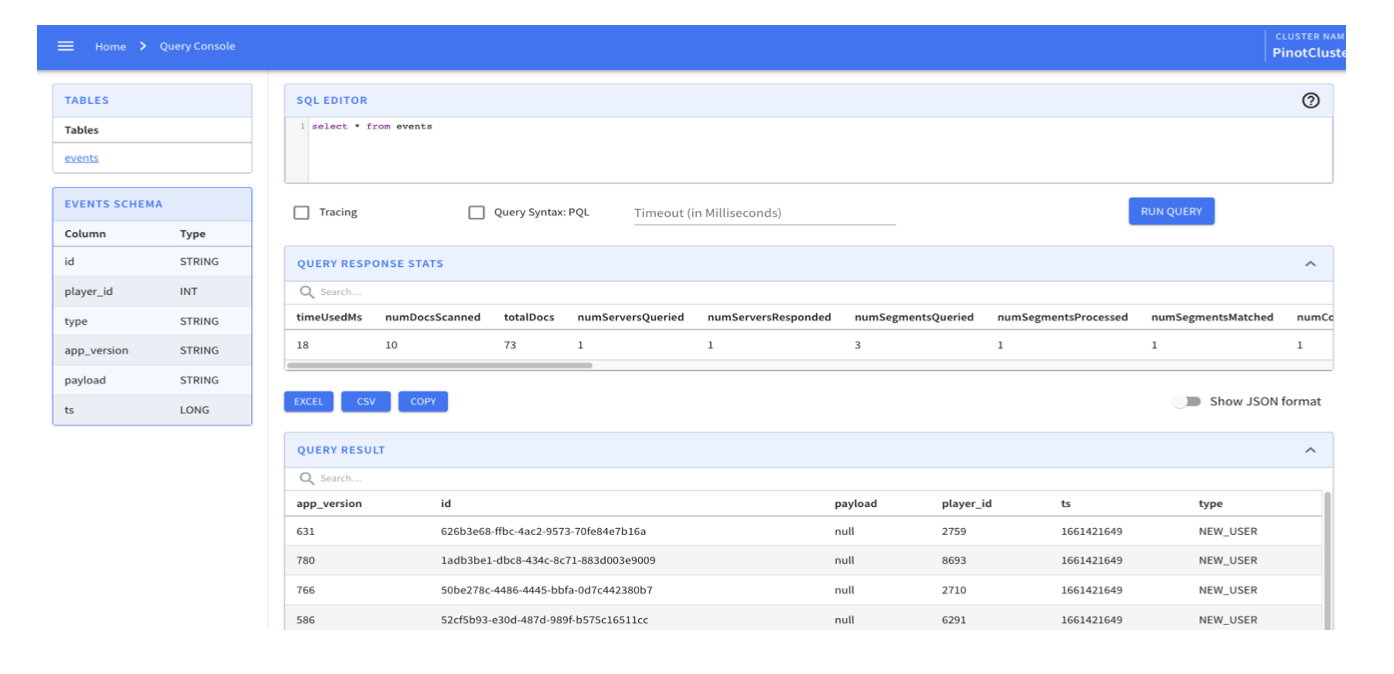
We create the events table in Pinot to ingest incoming gaming events from the gaming.events Redpanda topic. You can find the related schema and table definition files located inside the 1-analytics/config folder.
{
    “schemaName”: “events”,
    “dimensionFieldSpecs”: [
        {
            “name”: “id”,
            “dataType”: “STRING”
        },
        {
            “name”: “player_id”,
            “dataType”: “INT”
}, {
            “dataType”: “STRING”
        },
        {
            “name”: “app_version”,
            “dataType”: “STRING”
}, {
“name”: “type”,
“name”: “payload”,
9
“dataType”: “STRING”
        }
    ],
    “dateTimeFieldSpecs”: [
        {
            “name”: “ts”,
            “dataType”: “TIMESTAMP”,
            “format”: “1:MILLISECONDS:EPOCH”,
            “granularity”: “1:MILLISECONDS”
} ]
}
The events_schema.json file contains the events schema definition.
{
    “tableName”: “events”,
    “tableType”: “REALTIME”,
    “segmentsConfig”: {
      “timeColumnName”: “ts”,
      “timeType”: “MILLISECONDS”,
      “retentionTimeUnit”: “DAYS”,
      “retentionTimeValue”: “1”,
      “segmentPushType”: “APPEND”,
      “segmentAssignmentStrategy”:
“BalanceNumSegmentAssignmentStrategy”,
      “schemaName”: “events”,
      “replicasPerPartition”: “1”
    },
    “tenants”: {},
    “tableIndexConfig”: {
      “loadMode”: “MMAP”,
      “streamConfigs”: {
        “streamType”: “kafka”,
        “stream.kafka.consumer.type”: “lowLevel”,
        “stream.kafka.topic.name”: “gaming.events”,
        “stream.kafka.decoder.class.name”: “org.apache.pinot.plugin.
stream.kafka.KafkaJSONMessageDecoder”,
        “stream.kafka.hlc.zk.connect.string”: “zookeeper:2181/kafka”,
        “stream.kafka.consumer.factory.class.name”: “org.apache.pinot.
plugin.stream.kafka20.KafkaConsumerFactory”,
        “stream.kafka.consumer.prop.auto.offset.reset”: “smallest”,
        “stream.kafka.zk.broker.url”: “zookeeper:2181/kafka”,
        “stream.kafka.broker.list”: “redpanda:29092”,
10
“realtime.segment.flush.threshold.size”: 30,
        “realtime.segment.flush.threshold.rows”: 30
      },
      “nullHandlingEnabled”: true
    },
    “ingestionConfig”: {
      “complexTypeConfig”: {
          “delimeter”: “.”
      },
      “transformConfigs”: [
          {
              “columnName”: “ts”,
              “transformFunction”: “FromDateTime(created_at, ‘yyyy-
MM-dd’’T’’HH:mm:ss.SSSSSS’)”
} ]
    },
    “metadata”: {
      “customConfigs”: {}
    }
}
4. Visualize analytics with Streamlit
In the last mile of the analytics journey, we use Streamlit to visualize results returned by Pinot. This helps present insights to decision-makers in a format they can better understand and interpret.
Streamlit is a framework for writing data-driven applications in Python. It co-exists with other Python libraries to create beautiful visualizations. It connects to Pinot via the pinotdb Python driver, queries, and renders different gaming dashboards with response data.
You can find a Streamlit dashboard definition inside the 1-analytics/dashboard folder, producing different charts to show the following metrics:
Total events ingested
Total new user registrations
Breakdown of application errors against the version
5. Run the real-time game data analysis solution
First, we’ll start Redpanda and Pinot using Docker Compose with the following from the root level of the 1-analytics folder.
docker compose up -d
This starts a single instance of Redpanda and a Pinot cluster with a controller, broker, and server. Then you can start the simulation of gaming events to gaming.events Redpanda topic. Ensure Python 3 is installed on your machine.
python3 ./simulator/simulator.py
You can use Redpanda’s CLI tool, rpk, to observe content inside the gaming.events topic. A generic command line interface like kcat also does the trick.
6. Define the events table in Apache Pinot
In order to create an events table in the Pinot cluster, execute this command.
docker exec -it pinot-controller /opt/pinot/bin/pinot-admin.sh
AddTable \
-tableConfigFile /config/events_table.json \
-schemaFile /config/events_schema.json -exec
When the command returns, you can visit the Pinot Query Console using http://localhost:9000 to see the events table. The table should already be created and populated by incoming gaming events from the simulator.
7. Start the Streamlit dashboard
The final step in building your real-time game data analysis solution is visualizing the insights. For this, we launch the Streamlit dashboard.
First, install the Python dependencies needed for dashboard operation. Then navigate to the 1-analytics/dashboard folder and type the following command:
pip install -r requirements.txt
Now, you’re ready to launch the dashboard with this command:
streamlit run app.py
You can then access your dashboard by going to http://localhost:8501/
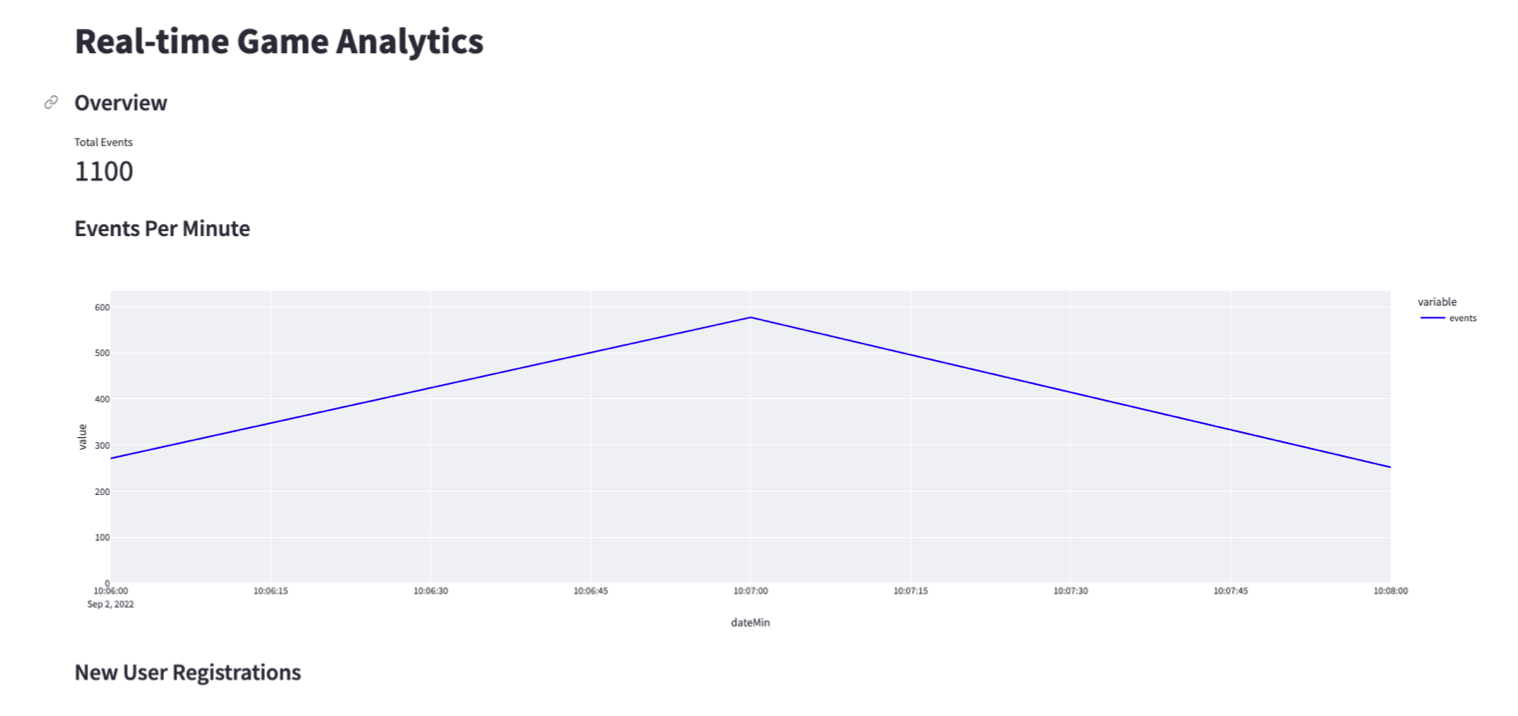
You now have a dashboard displaying your real-time gaming data! In this example you should see metrics about events received in the last minute, two bar charts plotting the variance of event count, and new user registration over time. You can always extend the dashboard to code to add your own metrics.
Win at real-time game data analysis with Redpanda
Gaming companies need fast and accurate insights to keep players happy and game revenue high. The biggest challenge of real-time game data analysis is securing actionable insights without racking up high operational costs.
In this post, we showed you how easy it is to capture events from gaming frontends and ingest them to Redpanda. Then we added the analysis with Apache Pinot, and finally shared the real-time insights in a Streamlit dashboard.
You can find the entire example project and the other Redpanda real-time gaming use cases in this Github repo. You can find more inspiration in our free report on how to turbocharge your games with Redpanda. We hope this will help you build better games while keeping your costs low!
If you’d like to discuss some of the gaming examples with our team, join our Redpanda Community on Slack, or contact us to find out how Redpanda can supercharge your game development.
Let's keep in touch
Subscribe and never miss another blog post, announcement, or community event. We hate spam and will never sell your contact information.


