How we built a robust system for real-time clickstream recommendations using generative AI, Redpanda, DataSQRL, and AWS

In today's digital age, the ability to process and analyze clickstream data in real time is a game-changer for businesses. The insights derived from this data can help businesses understand user behavior, optimize their websites, and deliver personalized user experiences.
However, building a system that can handle the volume and velocity of clickstream data, process it in real time, and deliver actionable insights or personalization with Generative AI (GenAI) is no simple feat. It requires integrating multiple complex technologies, deep expertise in data systems, and significant time and resources — challenges that can slow down or even derail data product development.
In this blog post, we'll introduce you to a lean yet reliable solution that leverages the power of DataSQRL, a compiler for data pipelines, Redpanda, a high-performance streaming data platform, and AWS, a comprehensive and broadly adopted cloud platform, to deliver real-time content recommendations from clickstream data using GenAI for personalization.
The best part? We’ll do it all in just 45 lines of code.
The challenge: clickstream data analysis is complex and expensive
In our data-driven economy, businesses need to leverage the vast amounts of data they collect to improve their operations and provide better experiences for their customers. One example is clickstream data analysis. Clickstream data, which records the pages a user visits and the sequence of clicks they make on a website, can provide businesses with invaluable insights into user behavior. These insights can be used to optimize websites, deliver personalized user experiences, and drive business growth.
However, building a system capable of handling, processing, and analyzing large volumes of clickstream data in real time can be complex, costly, and laden with delays. These systems require intricate integrations, deep expertise in data systems, and significant time and resources to build.
On top of managing data sources and sinks, implementing data transformations, optimizing data flow, and ensuring data consistency across the pipeline—developers also need to make sure the system is efficient, fault-tolerant, and scalable.
Traditional tools, while useful for simple data processing tasks, struggle with the complexities of real-time data processing at scale. They often require significant manual effort to integrate with other systems, lack flexibility, and struggle to operate efficiently at scale. Custom-built solutions can be tailored to specific needs but demand deep expertise in data systems and can be time-consuming and costly to develop.
Furthermore, the rapid pace of technological change means that developers must continually learn and adapt to new tools and technologies. For example, the recent advances in GenAI and large-language models (LLMs) enable organizations to build better personalized experiences for their customers. This constant need for upskilling can be a significant drain on resources and slows down the development process.
This is where DataSQRL, Redpanda, and AWS join forces to radically simplify the process of building real-time data products—and in this post, we’ll show you how.
The solution: Getting to know the technologies
First, we’ll properly introduce the technologies we’ll be using, and how they work together to deliver real-time insights from clickstream data.
DataSQRL
DataSQRL is a compiler for data pipelines. It allows developers to define data processing logic using SQL, a language that most developers are already familiar with. The SQL code is then compiled into a fully integrated data pipeline that combines Apache Flink® for real-time data processing with PostgreSQL for data storage. For the unfamiliar, Flink is a popular open-source stream processing framework, and PostgreSQL is a reliable open-source relational database.
DataSQRL also provides a GraphQL API to expose the results of the data processing, making it easy for developers to retrieve and use the data in their applications. This approach simplifies data pipeline development, reduces the need for deep expertise in data systems, and accelerates the development process.
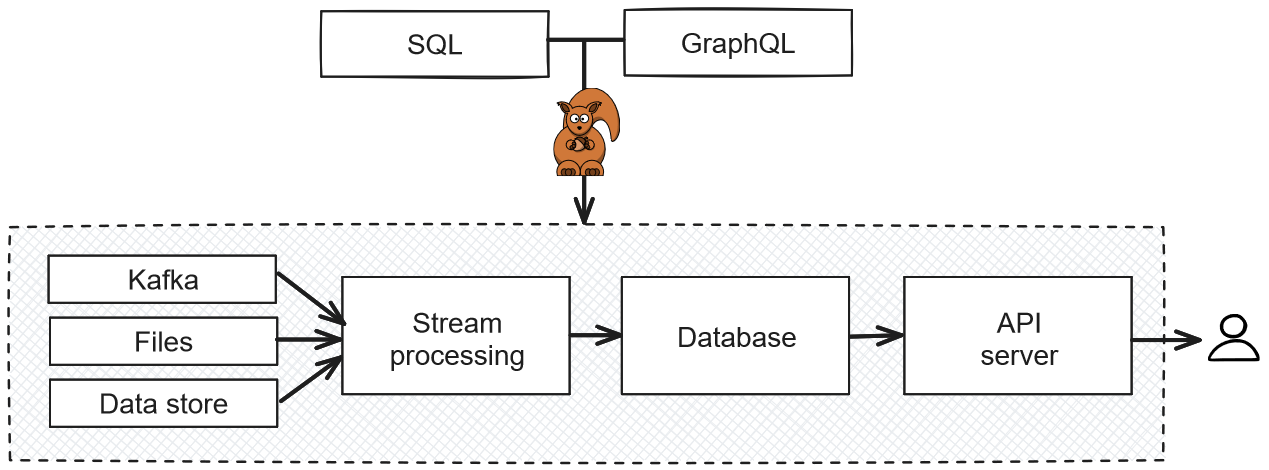
How DataSQRL fits into a data processing architecture
Redpanda
Redpanda is a high-performance streaming data platform designed to handle the volume and velocity of real-time data. It provides an Apache Kafka®-compatible API and is designed to be easy to use, cost-efficient, and reliable. With Redpanda, developers can focus on building their applications without worrying about the complexities of streaming data.
Redpanda's architecture is designed to ensure data consistency across the pipeline, even in the event of system failures. With powerful features like exactly-once semantics and fault tolerance, along with Redpanda Data Transforms (powered by WebAssembly) for simplified in-broker data transformations and pipeline efficiency, Redpanda is an ideal choice for real-time data processing applications.
AWS
AWS (Amazon Web Services) is the world's most comprehensive and broadly adopted cloud platform. It offers over 200 fully-featured services from data centers globally. In our solution, we'll leverage AWS for its robust infrastructure, scalability, and a wide array of services, like RDS for PostgreSQL.
Generative AI and Large-Language Models (LLMs)
Large-language models, like OpenAI’s GPT, can analyze text in a way that preserves its meaning. In particular, vector embeddings enable computers to represent a piece of content as a sequence of numbers that preserve semantic similarity. To humans, it’s pretty obvious that the words “cat” and “mouse” are more closely related than “cat” and “hat,” even though the latter sound and look more similar.
That’s what semantic similarity refers to the actual meaning of words and text.
So, vector embeddings allow us to process pieces of content and compute how semantically similar they are. We’ll use this technology to personalize our clickstream content recommendations.
Tutorial: how to build a real-time clickstream recommendation system
Now that we've introduced the technologies, let's see how they work together to build a real-time clickstream recommendation system using GenAI.
For developers following this tutorial, you'll specifically learn how to leverage existing SQL skills to define data processing logic, how to use GraphQL to expose results, and how to compile these into a fully integrated data pipeline using DataSQRL. To personalize the results, you’ll learn how to apply GenAI technologies like LLMs and vector embeddings in real time.
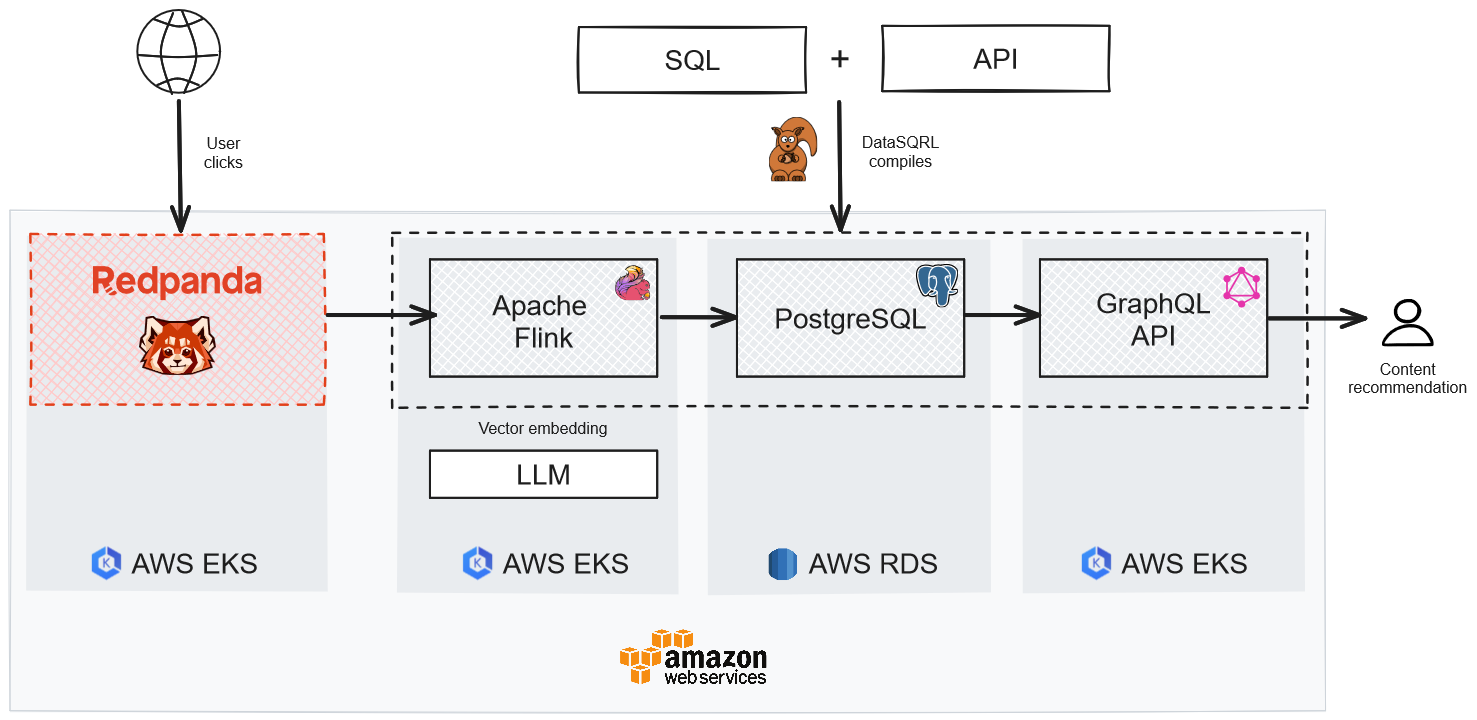
Architecture of a real-time clickstream recommendation system
The diagram above shows the architecture of our solution with the data flowing from left to right:
- Redpanda captures and records the user's engagement with content (i.e., web clicks).
- Flink ingests the clickstream data from Redpanda, processes the data to compute clickstream analytics, applies LLM vector embeddings for personalization, and stores the results in Postgres.
- The GraphQL API fetches the processed data from Postgres to serve real-time content recommendations to the user on request. Those requests come from the frontend application through which the user accesses the content.
Each of the four components of our architecture runs on AWS:
- Redpanda, Flink, and the GraphQL API server run on EKS, Amazon’s flexible Kubernetes service.
- We’re using the Amazon RDS Postgres service for the database.
It would be a lot of work if we chose to implement this architecture ourselves since we’d have to implement each component individually, orchestrate them, and make sure it all runs efficiently together. Luckily, DataSQRL can do that work for us.
DataSQRL simplifies the process of building real-time data products by allowing developers to define their data processing logic using SQL and GraphQL and compile this into a fully integrated data pipeline that combines Flink, Postgres, and GraphQL. This drastically reduces the need for deep expertise in data systems and accelerates the development process.
If you prefer to watch how it's done, here's a video walkthrough. For the readers, here's how to build our real-time clickstream recommendation system using DataSQRL in just a few steps.
Step 1. Analyze clickstream data with SQL
First, we implement the data processing logic for our clickstream recommendation system in SQL. We’ll use an algorithm that checks the frequency of co-visits to recommend content. The basic idea is this: if many users viewed content B after content A, then B is probably a good recommendation for a current user visiting content A. The official name for this type of algorithm is called “collaborative filtering” and it’s frequently used in recommendation systems.
To ensure that our recommendations are fresh, we’ll prioritize recent data. That’s one of the advantages of building real-time data products— you can react to changes in data quickly to serve your customers the best results.
IMPORT yourdata.Clickstream;  -- Import data
/* Find next page visits within 10 minutes */
CoVisits := SELECT b.url AS beforeURL, a.url AS afterURL,
                  a._source_time AS timestamp
           FROM Clickstream b INNER JOIN Clickstream a ON b.userid=a.userid
                  AND b._source_time < a._source_time AND
                      b._source_time >= a._source_time - INTERVAL 10 MINUTE;
/* Recommend pages that are visited shortly after */
Recommendation := SELECT beforeURL AS url, afterURL AS recommendation,
                        count(1) AS frequency FROM CoVisits
                 GROUP BY url, recommendation
                 ORDER BY url ASC, frequency DESC;
The SQL code snippet above implements a collaborative filtering algorithm for clickstream data that prioritizes recent data and updates in real time. Let's break it down.
IMPORT yourdata.Clickstream;
The first line imports the clickstream data from Redpanda. This data includes information about the pages visited by users, the sequence of their clicks, and the timestamps of their visits. DataSQRL uses an import manager that allows you to declare your data dependencies declaratively.
CoVisits := SELECT b.url AS beforeURL, a.url AS afterURL,
                  a._source_time AS timestamp
           FROM Clickstream b INNER JOIN Clickstream a ON b.userid=a.userid
                  AND b._source_time < a._source_time AND
                      b._source_time >= a._source_time - INTERVAL 10 MINUTE;
This section of the code identifies pairs of pages (beforeURL and afterURL) that a user visited within a 10-minute interval. It does this by joining the Clickstream table with itself on the userid field and applying a time constraint on the _source_time field which is the recorded timestamp in Redpanda. This effectively creates a new table, CoVisits, that records the sequence of pages visited by each user.
Recommendation := SELECT beforeURL AS url, afterURL AS recommendation,
                        count(1) AS frequency FROM CoVisits
                 GROUP BY url, recommendation
                 ORDER BY url ASC, frequency DESC;
The final part of the code generates the content recommendations. It selects the beforeURL (the page that a user is currently visiting) and the afterURL (the page that is most frequently visited after the current page) from the CoVisits table. The count(1) function is used to calculate the frequency of each beforeURL and afterURL pair.
The GROUP BY clause groups the results by url and rec, and the ORDER BY clause orders the results by url in ascending order and frequency in descending order. This means that for each URL, the most frequently visited subsequent URL is listed first.
The result is a new table, Recommendation, that provides real-time content recommendations based on recent user behavior. With DataSQRL, that’s only 13 lines of code.
The problem with engagement-based recommendation systems is that they cannot recommend new content. If we publish a new piece of content on our website, it cannot be recommended until users start clicking on the content. This is called the bootstrap problem.
To overcome the bootstrap problem, we are going to add a second type of recommendation algorithm that looks at the content a user has previously visited to recommend similar content. We determine content similarity by measuring the distance between the embedding vectors.
IMPORT yourdata.Content TIMESTAMP _source_time AS timestamp;
IMPORT vector.*;

Content.embedding := onnxEmbed(text, '/build/embedding/model_quantized.onnx');
Content := DISTINCT Content ON url ORDER BY timestamp DESC;

UserInterest := SELECT userid, CENTER(embedding) AS interest FROM Clickstream click
               TEMPORAL JOIN Content ON content.url = click.url
               GROUP BY userid;

SimilarContent(@userid: String) :=
SELECT c.*, coalesce(cosineSimilarity(i.interest, c.embedding),0.0) as similarity
FROM Content c LEFT JOIN UserInterest i ON i.userid = @userid
ORDER BY similarity DESC LIMIT 10;
Let's break down the code snippet for solving the bootstrapping problem:
IMPORT yourdata.Content TIMESTAMP _source_time AS timestamp;
IMPORT vector.*;
The first two lines import the content data from Redpanda and the vector operations needed for the next steps. We rename the timestamp column _source_time to timestamp for better readability.
Content.embedding := onnxEmbed(text, '/build/embedding/model_quantized.onnx');
Content := DISTINCT Content ON url ORDER BY timestamp DESC;
These lines create an embedding for each piece of content using the onnxEmbed function and a pre-trained ONNX model. The embeddings are vectors that represent the content in a high-dimensional space. The embeddings are stored in a new column in the Content table. The second line ensures that each URL in the Content table is unique and orders the content by the time it was last updated as recorded by the timestamp in Redpanda.
UserInterest := SELECT userid, CENTER(embedding) AS interest FROM Clickstream click
               TEMPORAL JOIN Content ON content.url = click.url
               GROUP BY userid;
This SQL statement creates a new table, UserInterest, that records the average (center) embedding of all content each user has clicked on. This gives a representation of each user's interests.
SimilarContent(@userid: String) :=
SELECT c.*, coalesce(cosineSimilarity(i.interest, c.embedding),0.0) as similarity
FROM Content c LEFT JOIN UserInterest i ON i.userid = @userid
ORDER BY similarity DESC LIMIT 10;
The final piece of code defines a function SimilarContent that takes a user ID as input and returns a list of content, ordered by how similar the content is to the user's interests. The similarity is calculated using the cosine similarity between the user's interest vector and the content's embedding vector. If a user has not clicked on any content yet, the cosine similarity is set to 0.
27 lines of code. And that’s all the code we need to write for a real-time recommendation engine that uses collaborative filtering and LLMs to recommend content to users. But we’re not done just yet, so let’s keep going.
Step 2. Expose your results with a GraphQL API
Next, you need to define how to expose the results of your data processing. DataSQRL uses GraphQL, a powerful query language for APIs, for this purpose.
To define the interface for our real-time recommendation engine, we define the schema of the API in GraphQL.
type Query {
   Recommendation(url: String!, limit: Int! = 10): [Recommendation!]
   SimilarContent(userid: String!): [SimilarContent!]
}

type Recommendation {
   recommendation: String!
   frequency: Int!
}

type SimilarContent {
   url: String!
   similarity: Float!
}
Step 3. Compile your data pipeline
Once you've defined your data processing logic and API, you can compile these into a fully integrated data pipeline using DataSQRL. The DataSQRL compiler takes care of all the complexities of building the data pipeline, including managing data sources and sinks, implementing data transformations, optimizing data flow, and ensuring data consistency across the pipeline.
To compile your data pipeline, simply run the DataSQRL compiler on your SQL and GraphQL files:
docker run -it -p 8888:8888 -p 8081:8081 -v $PWD:/build datasqrl/cmd compile recommendation.sqrl recommendation.graphqls -p redpanda.profile.docker --mnt $PWD
This will generate a fully integrated data pipeline that ingests raw data, processes it according to your defined logic, and serves the resulting data through your defined API.
Step 4. Run it!
To try this out yourself, download this ZIP archive that contains all the data and scripts you need. All you need is a local installation of Docker.
Unzip the archive on your hard drive, open the terminal, and navigate to the folder. Inside the folder, you’ll find the SQRL script and GraphQL schema file. The folder yourdata contains the connector configurations for our input data.
The folder embedding contains the embedding model we are using to compute the vectors. We are using an off-the-shelf embedding model called all-MiniLM-L6-v2 that’s been trained on a large, diverse corpus. The embedding model has been quantized so it runs efficiently on CPUs.
That means it’s a little slower than its GPU-optimized cousin, but easier and cheaper to run since we don’t need a GPU instance to execute our data pipeline. Unless you’re ingesting thousands of pieces of content every second, this will be efficient enough.
Finally, the yourdata-files folder contains the data we are using for this demonstration. For the content, we downloaded the subset of Wikipedia pages that contain the word “real-time”. That comes out to about 2600 pages stored in the compressed content.json.gz file.
The clickstream.json.gz file contains about 20,000 randomly generated website impressions of users visiting one of the content pages. The random generator for the clickstream data is open source and you can modify it to simulate your own clickstream workload.
Now we’re going to use the Python script load_data.py to publish this data into Redpanda. You’ll need python3 installed locally to run the script, or you can decompress the files (using gunzip) and publish the data with tools like kafka-console-producer.sh.
To run the data pipeline, follow these steps:
- Run the DataSQRL compiler in the root folder where the SQRL script is placed:
docker run -it -p 8888:8888 -p 8081:8081 -v $PWD:/build datasqrl/cmd compile recommendation.sqrl recommendation.graphqls -p redpanda.profile.docker --mnt $PWD
If you’re in Powershell on Windows, use ${PWD} instead of $PWD.
-
The compiler takes about a minute to produce all of the deployment artifacts for our data pipeline. Once it completes, you can find the deployment artifacts in the
build/deployfolder. Navigate to that folder. -
Inside that folder, you find a
docker-compose.ymltemplate that configures the entire data pipeline in Docker. The other files are the deployment assets used to run the individual components of the pipeline. -
Open the file
create-topics.shwhich is used to initialize the topics in Redpanda. Add the following lines beforeexit 0;to create the two topics for the content and clickstream data:
/opt/bitnami/kafka/bin/kafka-topics.sh --create --bootstrap-server redpanda:9092 --topic clickstream --partitions 1 --replication-factor 1
/opt/bitnami/kafka/bin/kafka-topics.sh --create --bootstrap-server redpanda:9092 --topic content --partitions 1 --replication-factor 1
-
Launch the pipeline by running
docker compose up. This will stand up all of the components, initialize them, and execute the pipeline. Note, that it might take some time until the pipeline is fully operational. -
Once the pipeline is up and running, it’s time to add the data. In another terminal window, navigate to the
yourdata-filesfolder and do the following in order:a. First, add the content for the web pages by running
python3 load_data.py content.json.gz localhost:9094 content --msg 50. This writes all of the content to the topic. Wait until it finishes which takes about two minutes (we need all the content in there before we can click on it). Check the Flink Dashboard running athttp://localhost:8081/to see the progress of consuming the content. Since computing the vector embeddings is quite resource-intensive, you will likely see one task turn red (which indicates it's busy). Wait until it's blue again.b. Second, add the content for the clickstream by running
python3 load_data.py clickstream.json.gz localhost:9094 clickstream --msg 100. This loads 100 clicks per second. Wait a few seconds for some data to load. However, you don't have to wait for all of it to load. After a second or two, data should be processed and queryable. Let this run in the background until it finishes (which takes about four minutes).
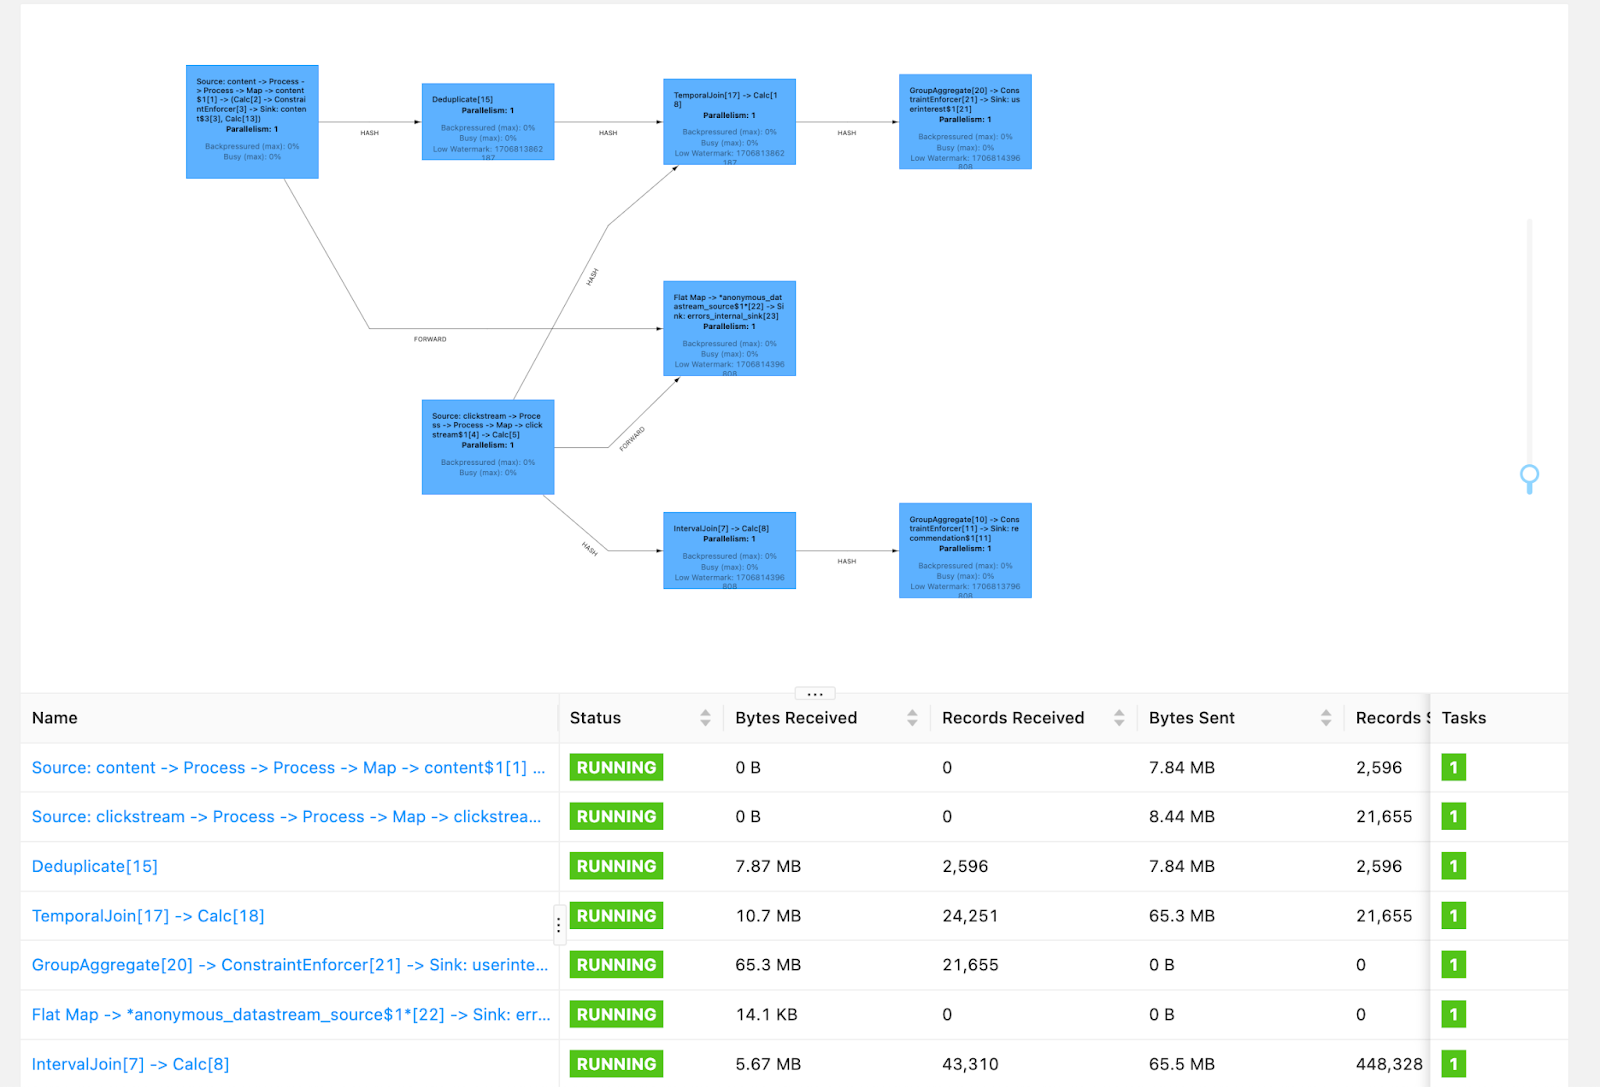
Screenshot of the Flink job in the Flink dashboard
You can take a look at the Flink dashboard to see how the job is progressing. Depending on your hardware, you can see that the pipeline analyzes 100s of clicks per second in this development setup.
As the pipeline processes the clickstream data, we can start querying for results. Open http://localhost:8888/graphiql/ in your browser to access GraphiQL. GraphiQL is an application that makes it easy to query GraphQL APIs through the browser. You write the query in the left-hand panel, hit the run button, and the results are shown on the right. Alternatively, you can access the GraphQL API via the command line or from any application at localhost:8888/graphql.
To retrieve recommendations of related pages for a given page, you can run this query:
query {
 Recommendation(url: "https://en.wikipedia.org/wiki/Generosity%3A%20An%20Enhancement") {
   recommendation
   frequency
 }
}
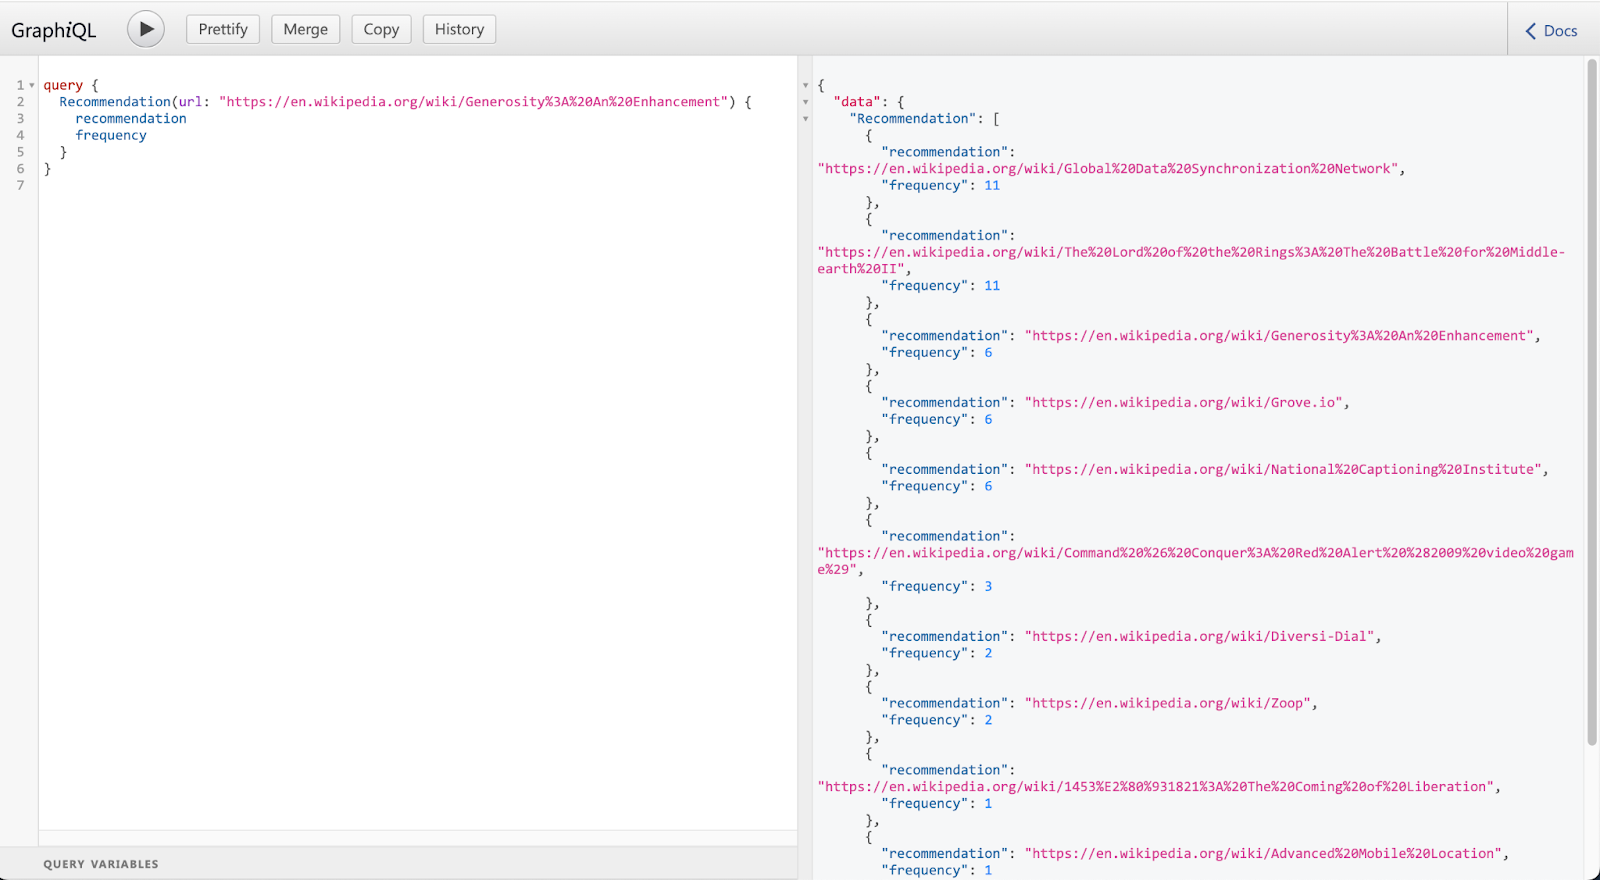
Querying for recommendations through the GraphQL API in GraphiQL
To retrieve recommendations of pages a user might like to visit based on their past visits, run this query:
query {
 SimilarContent(userid: "f5e9c688-408d-b54f-94aa-493df43dac8c") {
   url
   similarity
 }
}
Feel free to play around with the API by using different page URLs (see the content.json.gz file for all available URLs) and different user ids (you can find used user ids in the clickstream.json.gz file). You can also add additional content or clickstream data by adding records to the respective topics in Redpanda. Make sure you use the same JSON structure as the data in those files.
Once you’re done, hit CTRL-C and take down the pipeline containers with docker compose down -v.
Step 5. Deploy on AWS
In addition to running the pipeline locally, you can also deploy it in the cloud on AWS using AWS EKS and AWS RDS. You can use the deployment artifacts from the build/deploy folder as a starting point. In a follow-up blog post, we’ll describe this cloud deployment in detail and provide a benchmark to analyze how it performs.
In particular, we’ll discuss how to optimize the pipeline for scalability so you can effortlessly analyze thousands of clicks a second. We’ll look at partitions, parallelization, and API configuration and see how DataSQRL makes it much easier to optimize a real-time data pipeline end-to-end.
Wrapping up and next steps
In just 45 lines of code, we built a real-time generative AI-enabled, clickstream recommendation engine and exposed it through a responsive API to serve user recommendations in milliseconds. With DataSQRL and Redpanda, real-time data products do not need to take months, teams of people, and a huge budget to implement.
To learn more, you can visit datasqrl.com, which offers a wealth of resources and tutorials to help you get started with DataSQRL. You can also dig deeper into each of the technologies used in this post – Redpanda, AWS, and generative AI – to better understand their capabilities and how they can be used in other data processing tasks.
We encourage you to take the next step and try implementing this solution yourself. The code and data is open and available in this GitHub repo so you can experiment with building your own real-time clickstream recommendation system.
Finally, we invite you to join the DataSQRL community, as well as the Redpanda Community on Slack. You’re also welcome to star DataSQRL on GitHub, contribute to the project, and connect with other developers who are using DataSQRL to build real-time data products. This is a great opportunity to learn from others, share your experiences, and help shape the future of data product development.
Stay tuned for our encore where we look at the AWS deployment in more detail and analyze the performance of the solution.
– Matthias Broecheler, Founder, DataSQRL
Let's keep in touch
Subscribe and never miss another blog post, announcement, or community event. We hate spam and will never sell your contact information.


