A blueprint to help you equip users with the right insights at the right time
The word "decision-maker" likely makes you immediately think of "C-suite" or "executive." But nowadays, we’re all decision-makers. Whether you're a banker or a blogger, you have important decisions on your plate and need accurate insights to make them.
With the rise of SaaS and self-serve data platforms, organizations are constantly looking for ways to equip their employees with the insights they need to make data-driven decisions. Having access to fast, fresh analytics is expected to speed up decision-making and foster a data-driven culture within the organization.
User-facing analytics provides customers and employees with direct access to data analysis results. This typically involves dashboards that display data using graphs and other easily understandable formats. Essentially, the goal of user-facing analytics is to provide the data users need to make informed decisions without relying on data analysts or other specialists.
There are three crucial aspects of user-facing analytics: data freshness, query latency, and query throughput. This post introduces a solution architecture for implementing a scalable user-facing analytics solution and explains how each component efficiently addresses each aspect.
What to consider before building user-facing analytics
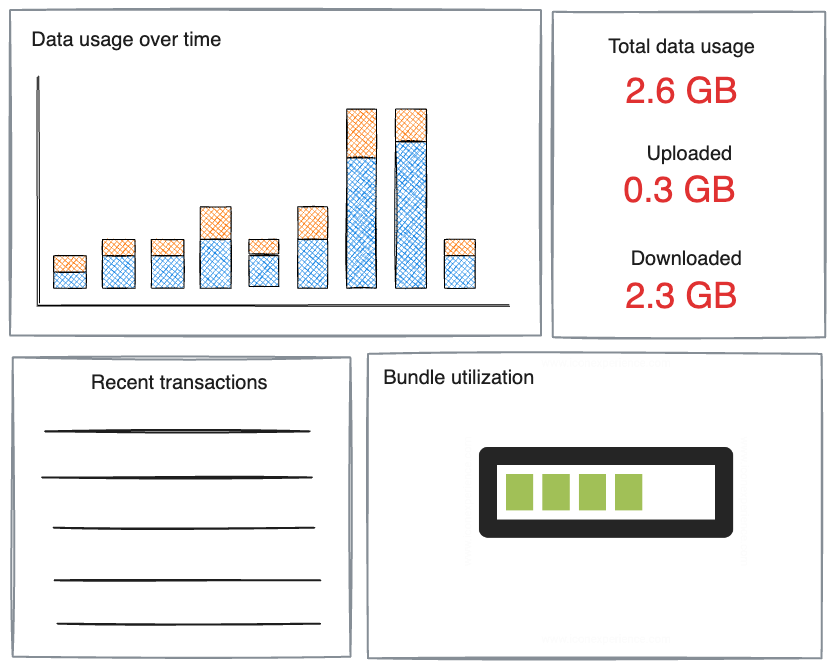
Think of a user logging into their mobile service provider's mobile application. The user might see a dashboard that shows how much data they've used in the current billing cycle, how much data remains in their package, and a forecast based on their current consumption rate. This dashboard might also provide insights into their usage patterns, such as peak usage times or the apps that consume the most data.
This real-time information can help the user make informed decisions about their data usage and avoid overage charges.
But what does it take to design and implement such a dashboard? Implementing a user-facing analytics solution requires three critical characteristics:
Data freshness is the ability to ingest and process data in real time, ensuring users have the most current insights.
Ultra-low query latency is key to a responsive user experience. It allows complex queries to be processed quickly, even when dealing with large volumes of data.
High query throughput, facilitated by a system's capacity to handle a large number of simultaneous queries, is crucial in user-facing analytics because it ensures the system can support a large user base without slowing down or crashing. This results in a seamless and responsive user experience, even under heavy load.
How to design a user-facing analytics solution
Now let’s explore a potential reference architecture for user-facing analytics.
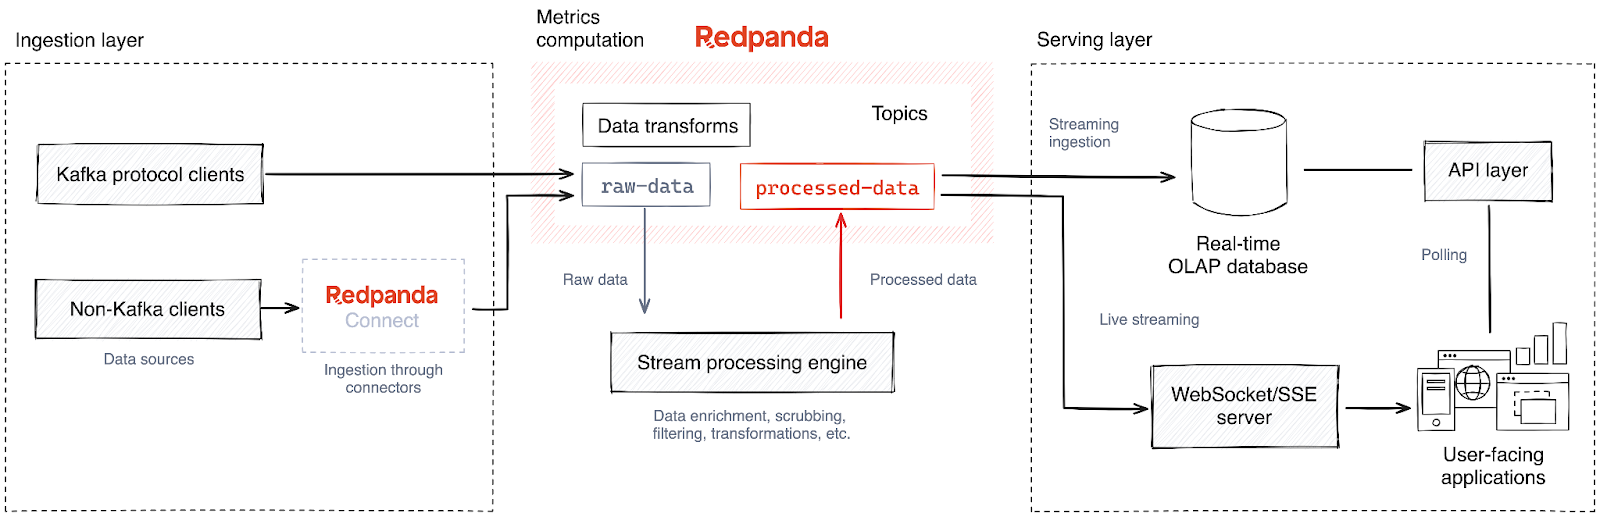
The diagram above packs in various technologies, so we’ll break it down into three layers based on the direction of the data flow (from left to right).
1. Ingestion layer
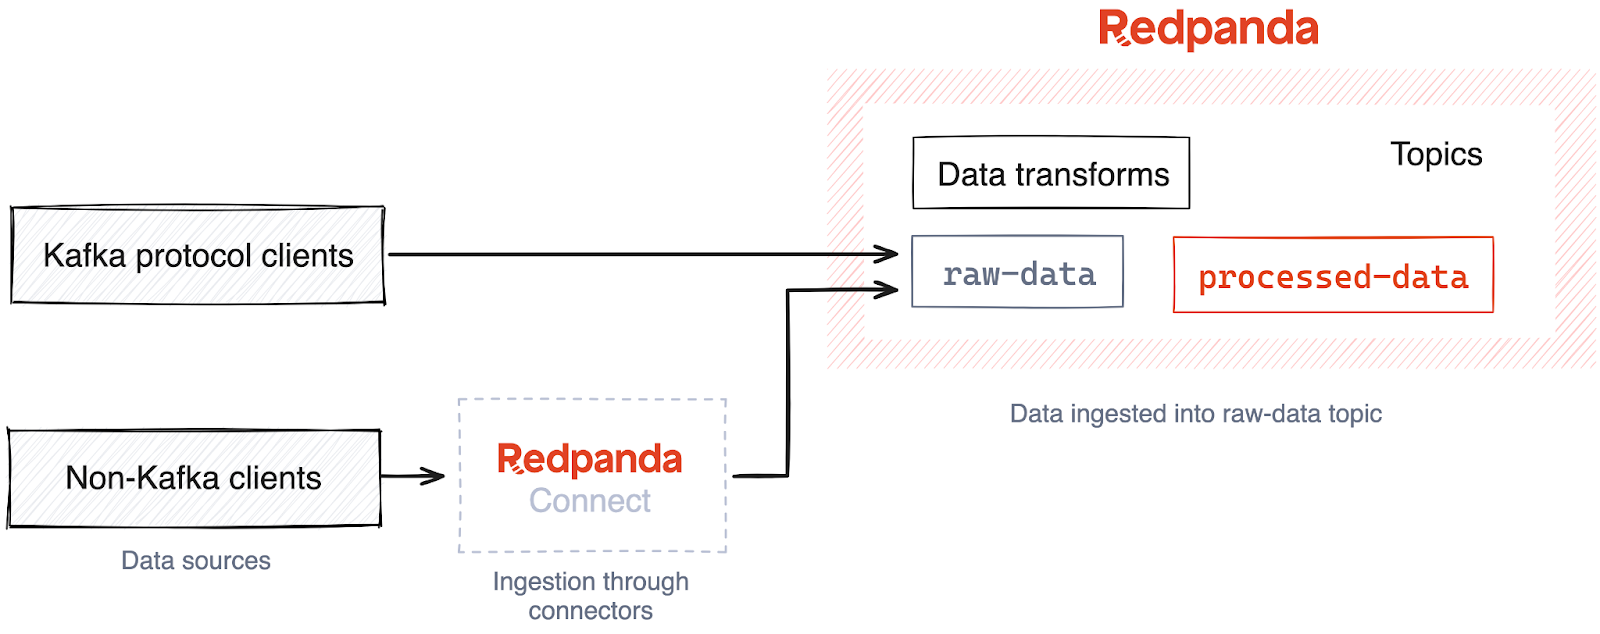
Data ingestion is the first layer of this architecture. It collects data from various sources and delivers it to the analytics datastore to run queries later.
The data sources can include anything that users and the business plan to track and monitor for state changes, including change data streams from databases, transactional events from microservices and line of business applications, etc.
Once captured from data sources, the data is ingested into a streaming data platform like Apache Kafka® or Redpanda — a leaner and more performant Kafka alternative — allowing downstream components to process the data in real time. In the architecture diagram above, you might notice that Redpanda is in the data pipeline instead of directly moving data to the analytics data store. There are several benefits to this approach. It:
Introduces decoupling. Data sources and the analytics data store are decoupled, allowing both parties to scale and evolve independently.
Eliminates synchronous writes and acts as a load leveler. Redpanda can absorb and buffer sudden traffic surges from data sources, preventing the analytics infrastructure from becoming overwhelmed.
Introduces publish-subscribe semantics. The data ingested into Redpanda can be routed to multiple destinations in real time allowing concurrent processing. For example, the data can be synced into a data lakehouse for archival purposes while feeding the analytics data store.
Data sources produce data to Redpanda via the Kafka API. This means clients that already natively support the Kafka API can integrate with Redpanda without any changes to the codebase. They simply continue to produce messages as they would to a Kafka broker, but the endpoint would be a Redpanda broker instead.
Redpanda Connect for data integration
What about the clients that do not natively support the Kafka API? They could use Redpanda Connect to seamlessly transfer data from different systems to Redpanda, even those that don’t comply with the Kafka protocol.
For the unfamiliar, Redpanda Connect is a lightweight stream processor that helps you compose streaming ETL pipelines that move data across systems. Declared with YAML, Redpanda Connect comes with 200+ prebuilt connectors to extract data from a wide range of data sources and bring them to Redpanda efficiently and reliably.
Alternatively, you could use other platforms in the Kafka ecosystem because of Kafka API compatibility, such as Kafka Connect.
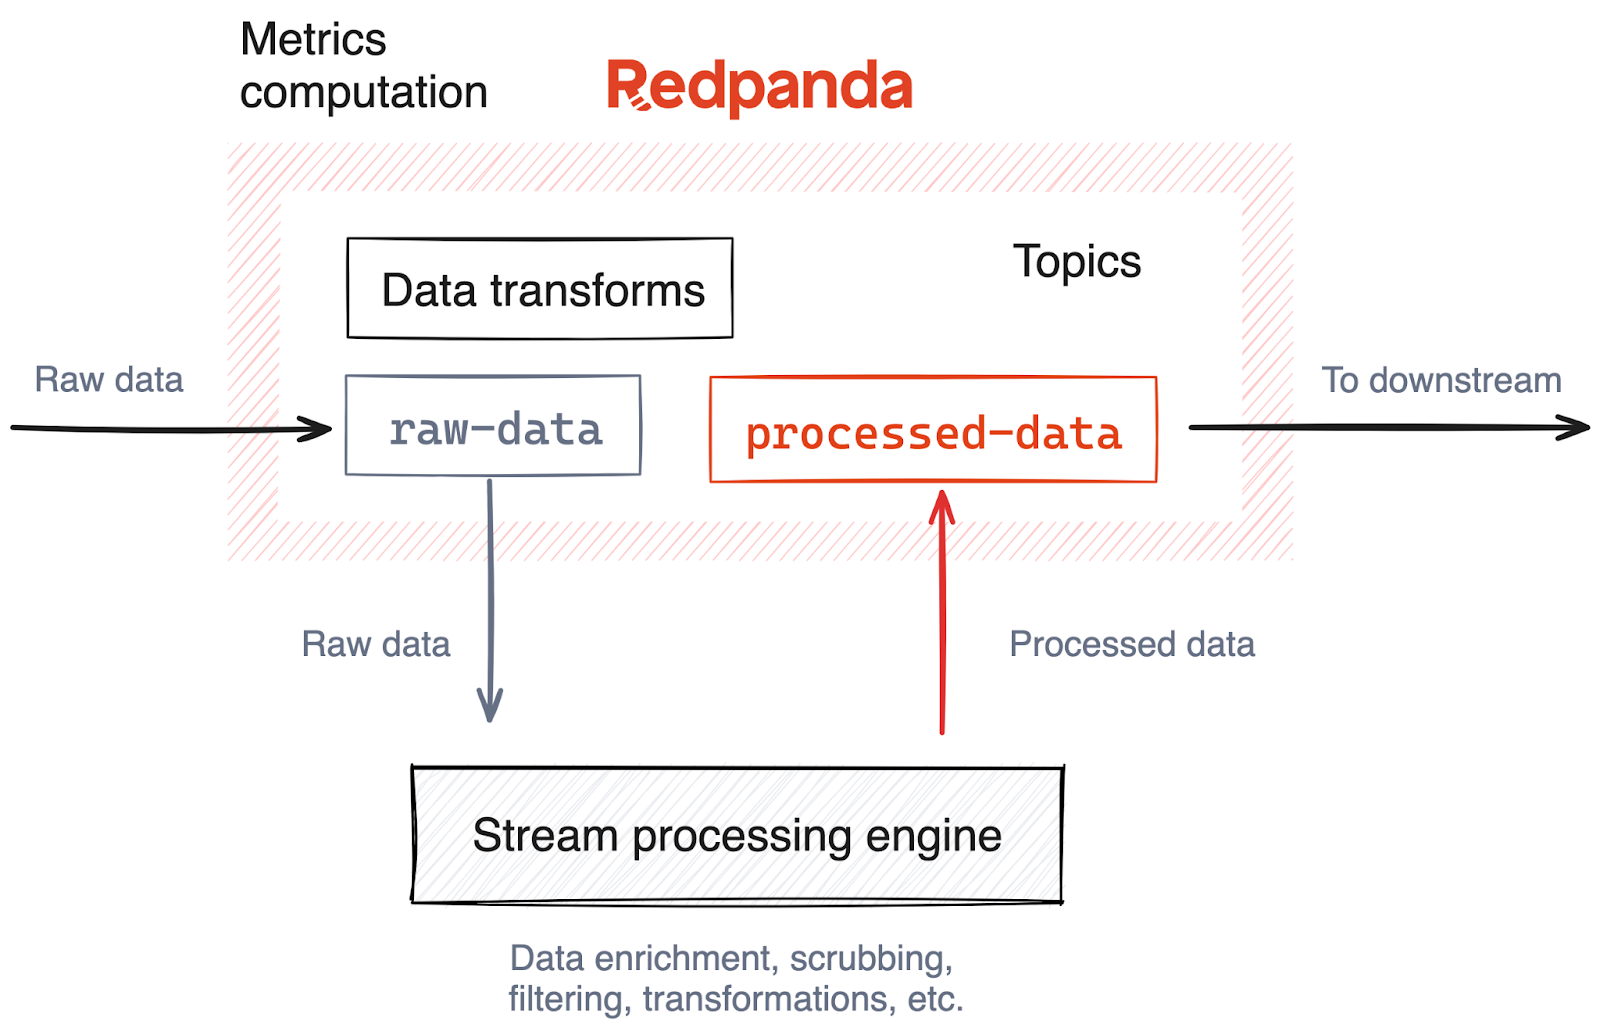
2. Metrics computation
Once the data arrives at Redpanda, it requires cleansing and transformations before being sent to the analytics data store.
For instance, the data may need to be transformed into a format that can be easily queried. This can involve enriching the data with additional context, normalizing values, or converting data types. Additionally, you might need to filter out irrelevant data or handle missing or erroneous data points. In some cases, complex calculations might be required to create derived metrics that are more relevant for analysis.
These transformations should be done in real time as data arrives from Redpanda to minimize the processing latency. So, we’ll opt for a stream processing engine over batch and micro-batch processing technologies. This stream processor can perform stateful aggregations, lookup joins for enrichment, joins between streams, and window operations to transform the data into a format ready for running analytics.
Analytical data store
The final stage of the data pipeline is the serving database. This is where we store the transformed data that’s ready to be served to users.
From a technology perspective, we use a real-time online analytical processing (OLAP) database, like Apache Druid, Apache Pinot, or ClickHouse because they go above and beyond to meet the user-facing analytics requirements we mentioned above.
Key reasons include:
Supports streaming data ingestion. Real-time OLAP databases natively support data ingestion from streaming data sources, such as Kafka and Redpanda, ensuring increased data freshness.
Ultra-low query latency. Real-time OLAP databases deliver ultra-low query latency because of their efficient data storage format and indexing mechanisms. This ensures that even complex queries can be processed quickly, providing users with a great user experience.
High query throughput. Real-time OLAP databases support high concurrency, which means they can handle a large number of simultaneous queries. This is possible due to their distributed architecture, which allows for effective data partitioning and parallel processing of queries. High concurrency support is crucial in user-facing analytics because it ensures that the system can serve a large number of users at the same time without slowing down or crashing. This leads to a smooth and responsive user experience, even under heavy load.
If we use Apache Pinot as the analytics data store, it can be configured to ingest data from a Redpanda topic, where the stream processor streams the transformed data. Once ingested, Pinot converts the data into relevant Pinot tables, allowing you to run SQL queries immediately. This approach allows users to access the generated insights while the data is still fresh and relevant.
3. Serving layer
The last mile of the solution is the serving layer. This is where the metrics stored in the analytical database are served to its audience, primarily the users of the application.
For user-facing applications, we can expose the analytics database through an API layer. These APIs can fetch specific metrics or aggregated data, which can then be displayed in the application's user interface.
For example, Apache Pinot provides Java Database Connectivity (JDBC) and Open Database Connectivity (ODBC) query interfaces and language-specific driver implementations like Python. This enables frontend application developers to create user-facing data products and dashboards using front-end technologies they are most comfortable with. Additionally, developers are not exposed to the complexity of the data processing layer.
For internal audiences, such as product managers or data analysts, you can use data visualization tools that connect directly to the analytics database. These tools provide a detailed view of the data, allowing for deep dives and more complex analyses. This is particularly useful for understanding trends and patterns and making data-driven decisions.
Streaming metrics serving
Sometimes application clients can't poll the serving layer but need real-time insights as they are processed. Examples of this include low-latency, real-time applications like stock trading desks, live sports stats, broadcasting apps, and so on.
To satisfy these clients, we can bypass the analytics serving layer and directly stream from the processed insights topic in Redpanda. However, it should be served via a web-friendly streaming protocol such as WebSockets or Server-sent Events (SSE).
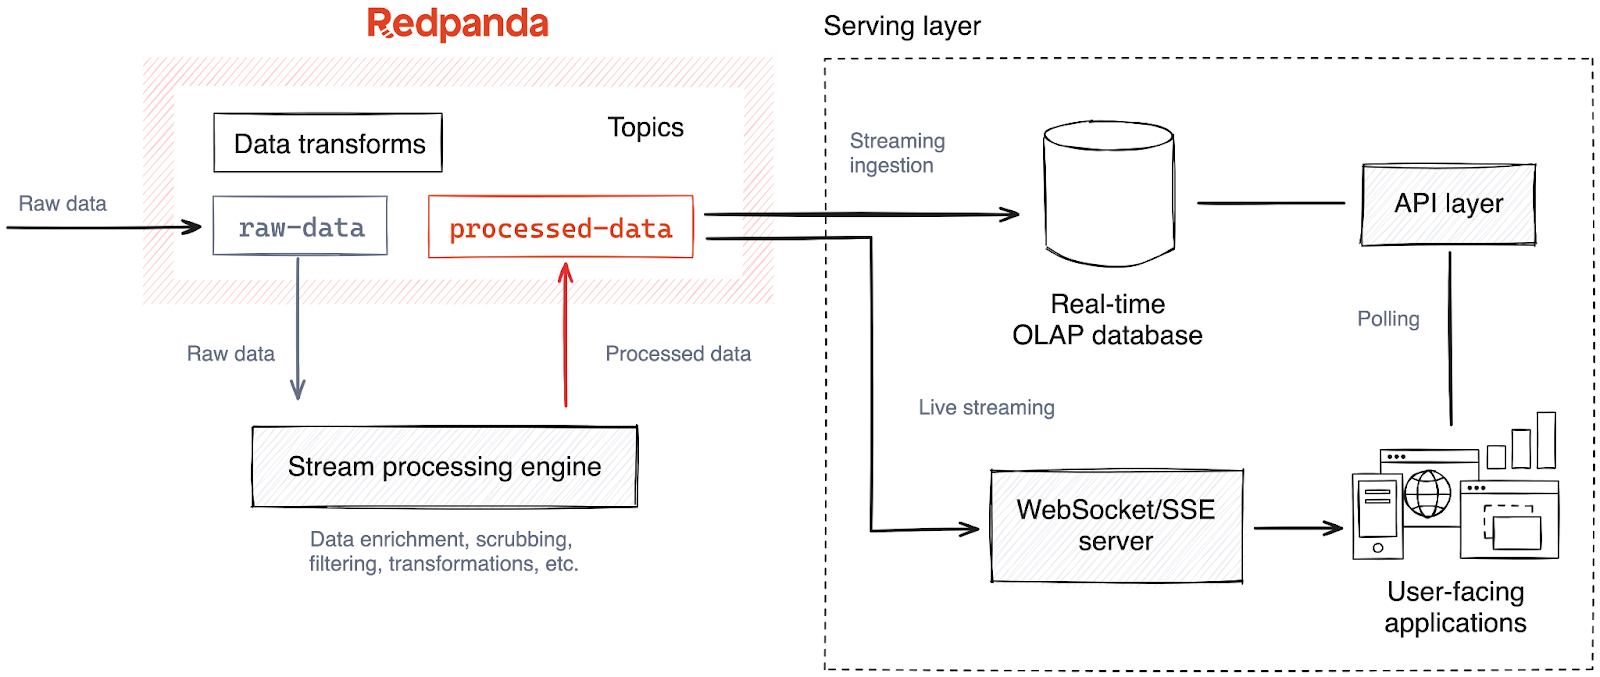
These protocols have been designed with low latency and reliability in mind, which is handy when delivering fast-changing content from servers to clients. Furthermore, these protocols are supported and implemented by many web browsers and devices across the Internet, reaching a wider audience.
Get connected with Redpanda Connect!
The architecture can be a handy reference for data engineers, data architects and IT professionals designing and implementing analytic solutions. It can also be useful for product managers or business decision-makers interested in understanding how insights from data can be made directly accessible to end-users in a real-time, user-friendly format.
Our proposed solution delivers real-time insights to its users while preserving data freshness, minimizing latency, and withstanding high query throughput. We mentioned a few technological choices in the solution, but you’re free to swap them with your preferred alternatives.
The key takeaway is understanding the layered architecture and the data flow between layers. This knowledge will help you build a streamlined user-facing analytics solution to bridge the gap between your users and the data they need to uplift your organization.
Ready to get started? Try Redpanda for free and browse the Redpanda Connect docs. If you get stuck or have questions, give us a shout in the Redpanda Community on Slack.
Originally published on The New Stack.
Let's keep in touch
Subscribe and never miss another blog post, announcement, or community event. We hate spam and will never sell your contact information.


